DA Boy - Ocean Color Satellite Imaging
Within two years of Sputnik's launch, both the US and the USSR were taking pictures of the Earth; the first satellite images were taken by Explore 6 in August, 1959. Since then, satellite sensing technology has become embedded in everyday life. Some applications most people are familiar with are mapping programs and meteorological data collection. Less familiar applications include measuring aerosol and vegetation levels. Satellite imaging is particularly useful for gathering data about the ocean, because the open sea is so vast and remote. Here I describe the ideas behind ocean color satellite imaging and describe a current research application.
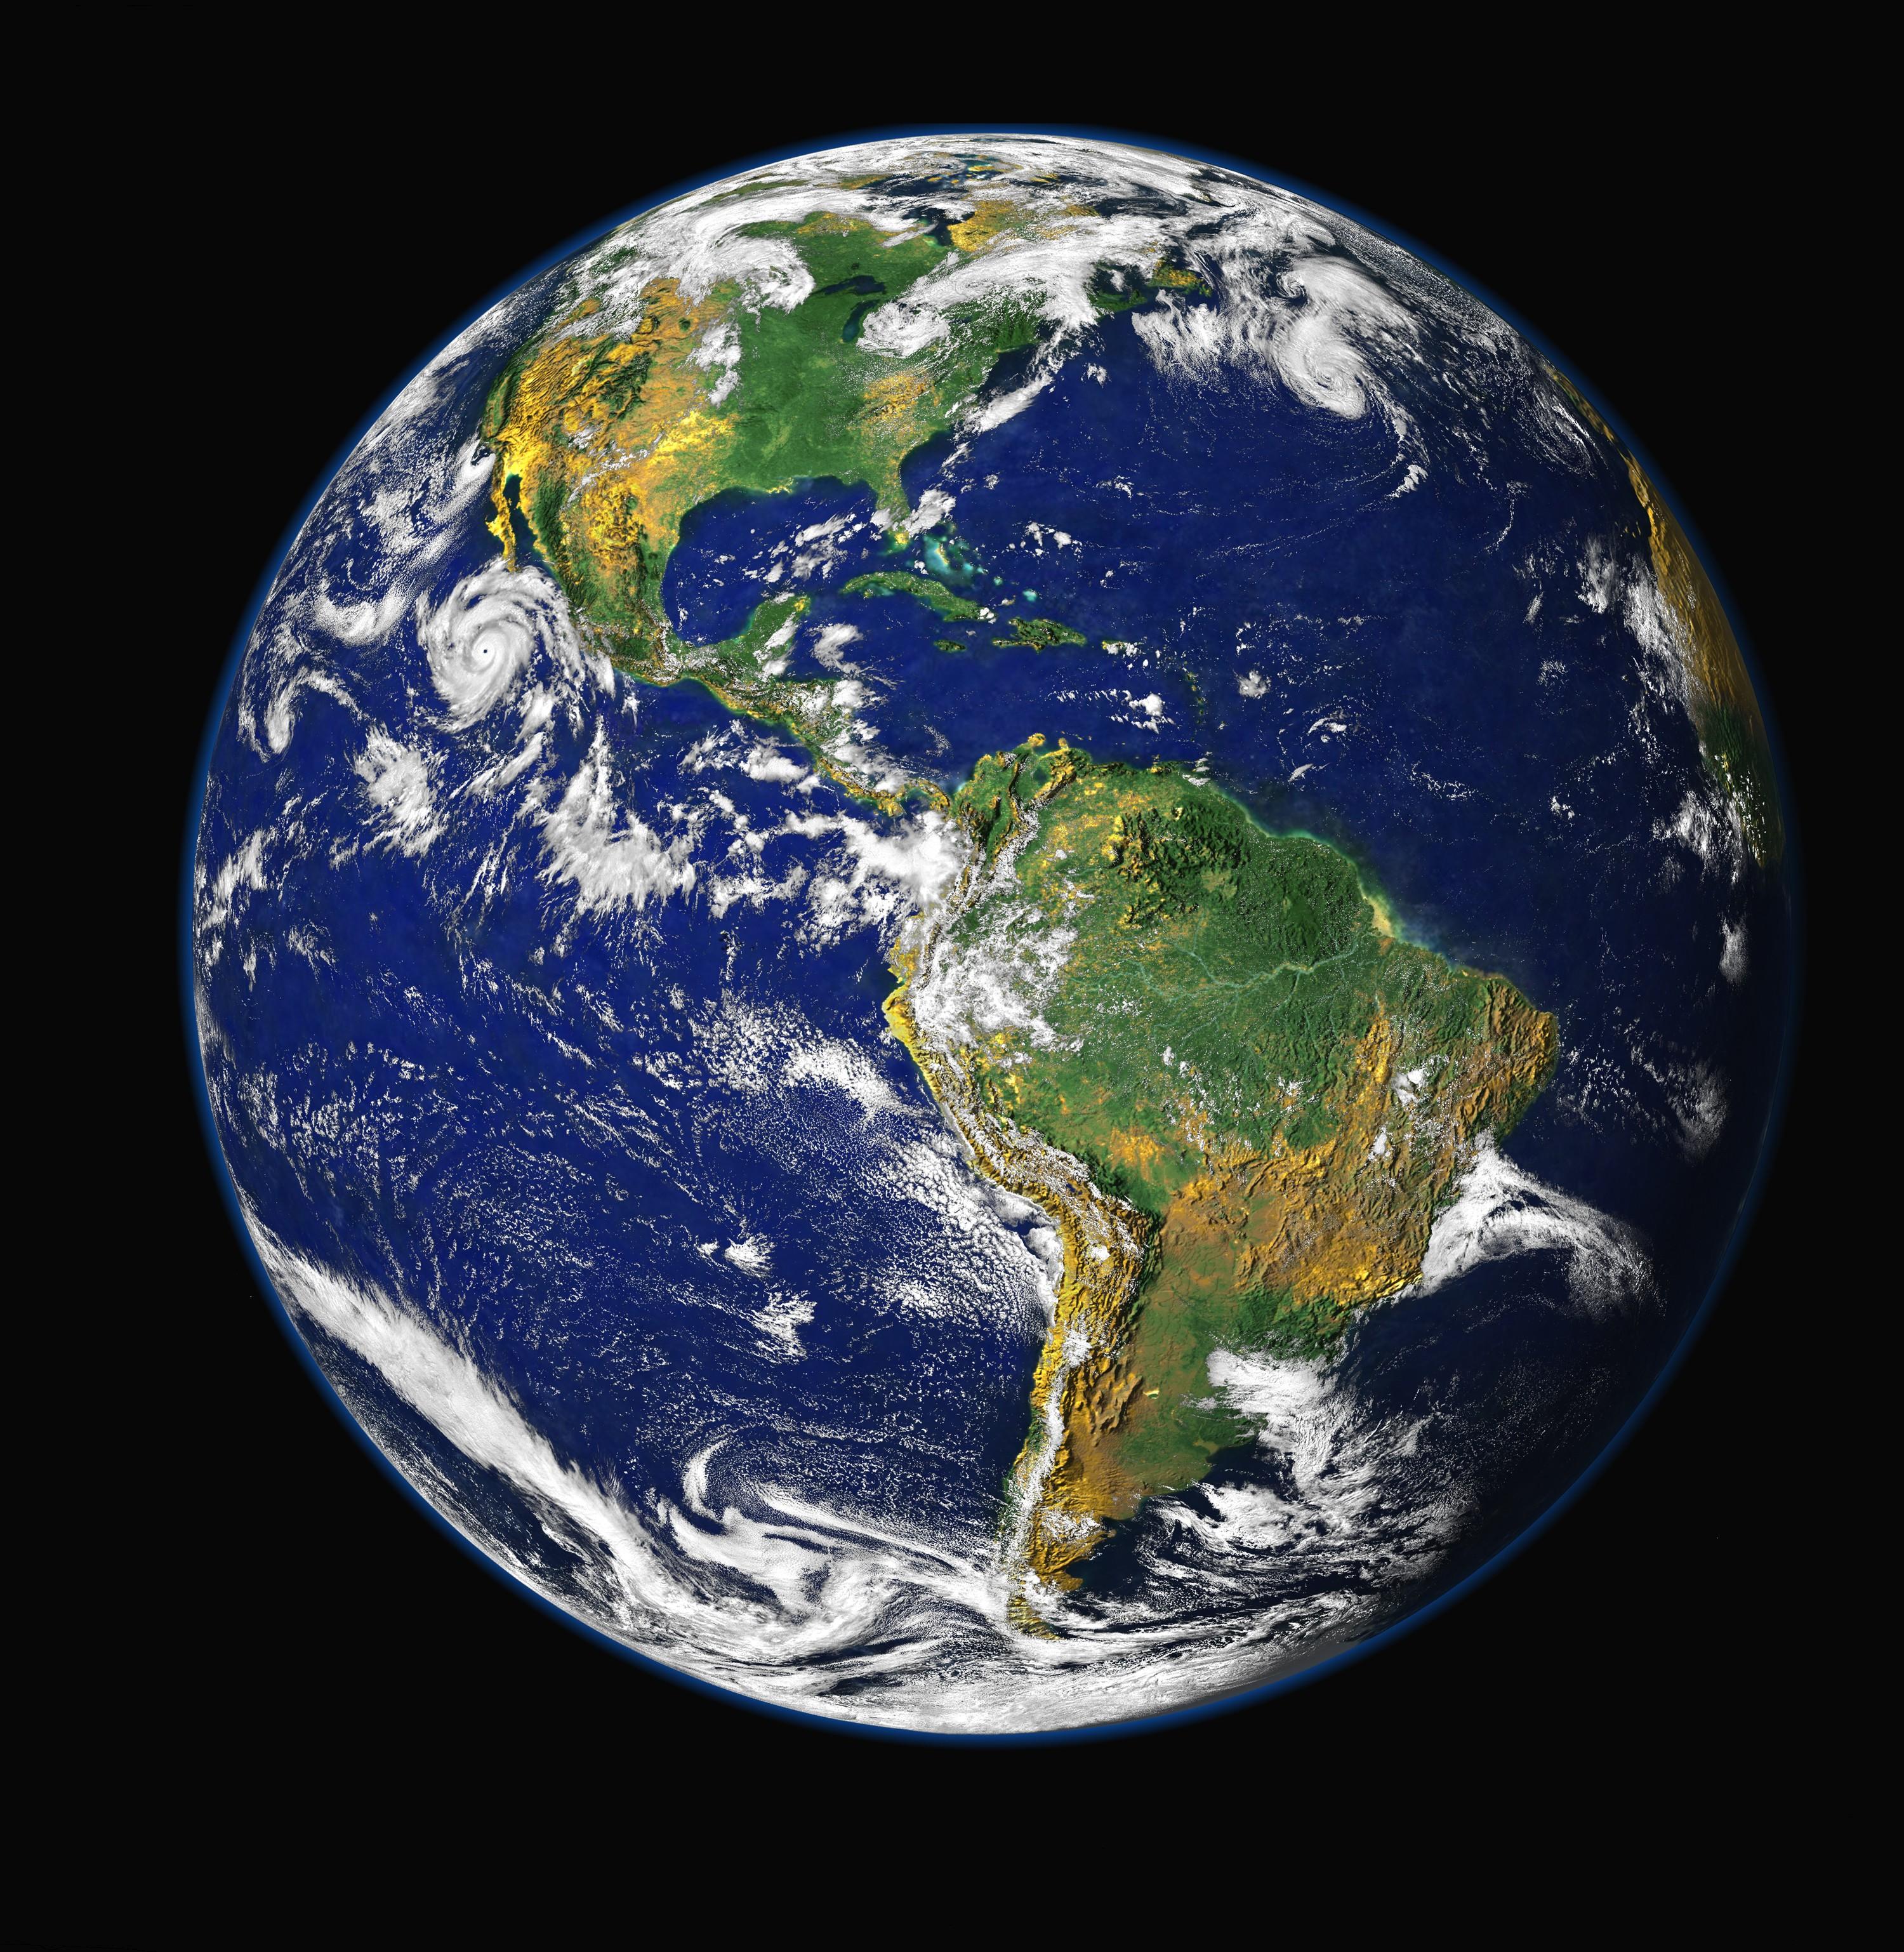
This is the famous "Blue Marble" satellite image of the Earth.
http://earthobservatory.nasa.gov/
There are many types of satellite sensors--scanning vs. non-scanning, passive vs. active, imaging vs. non-imaging--but here I describe passive imaging techniques.
All ocean color satellite imagery is based on similar science and technology. Electromagnetic energy from the sun travels through the Earth's atmosphere, reflects off the surface of the Earth, travels back through the atmosphere, and is finally absorbed by sensors on the satellite. On-board electronics convert the electromagnetic signal to digital data and transmit it to data centers. Each satellite has a telescope and many sensors that can detect energy in different bands of the electromagnetic spectrum. Sensor systems that detect many bands are called multispectral or, in the case of hundreds of bands, hyperspectral.
![]() http://www.globalwarmingart.com/wiki/Image:Atmosphere_Transmission_Blackbody_Only_png
http://www.globalwarmingart.com/wiki/Image:Atmosphere_Transmission_Blackbody_Only_png
Most satellite imaging is passive, which means that sensors detect the energy being reflected or emitted by the environment, as opposed to broadcasting energy and then detecting the reflection (like radar, sonar, or lidar systems do). The electromagnetic radiation of the sun is nearly that of a black body at about 5500K. This is shown by the thick red line in the above figure. The radiation travels unimpeded until it reaches Earth's atmosphere. While passing through the atmosphere, the energy of some parts of the electromagnetic spectrum is absorbed. The energy that makes it to Earth's surface is the solid red region in the above figure; the difference between the line and the solid is the energy absorbed by the atmosphere. Also, the Earth emits its own radiation loosely corresponding to a much cooler blackbody, shown by the solid blue region.
Such information is important because different substrates reflect and absorb different bands of the electromagnetic spectrum. For example, cloud and surface temperature signals are detected at 3.66-4.08 micron and 10.78-12.27 micron wavelengths, while ocean color and phytoplankton is detected at 405-877 nanometer wavelengths. This property of matter is what makes remote sensing so powerful, but it means that knowing the solar power spectrum and correcting for the absorption and reflectance of the atmosphere--and a myriad of other factors--is critical to proper interpretation of the final signal.
The next question to ask, of course, is "How are these electromagnetic waves turned into digital signals?" There are many ways to do it, but the most common detectors use semiconductors that, when struck by photons with the right wavelength, experience a change in conductivity. This change is measured by electronics on the satellite. Different materials respond to different wavelengths. As a satellite moves around the Earth, it scans a swath, as shown in the figure below. Then, to construct an image, mirrors sweep the focus of a detector across the swath , building images one pixel at a time. A movie illustrating this process is linked to from the figure.

Reto Stockli, NASA GSFC, http://visibleearth.nasa.gov/
The next most common kind of detectors is charge-coupled devices (CCDs). Generally, they are more reliable, because they have no moving parts, and they can have much greater spectral resolution. This is the technology that SPOT uses, as well as the technology in most digital cameras. For more information on CCDs, see Nikon MicroscopyU.
In addition to the detectors, satellites have advanced optics, including filters, lenses, and mirrors; the schematic below provides a small taste of these. These systems are complicated, vary from system to system, and are not addressed here.
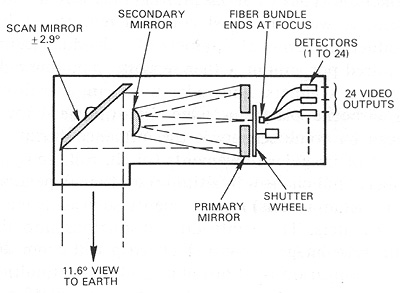
http://rst.gsfc.nasa.gov/
After collecting the data, the satellite sends it to a ground-based receiver at rates of megabits or sometimes gigabits per second. The data is then converted into standard formats that can be (more) easily analyzed and distributed. The satellite operators--e.g. NASA, SPOT Image--do frequent and intense calibration to make sure that the data received is well characterized, but they do not typically modify the data before distributing it. Tools for processing and visualizing satellite imagery range from Google Earth to large, commercial GIS products to relatively low-level MATLAB programming.
At UCSB, Cavanaugh and Siegel are using SPOT imagery to estimate the biomass of kelp in kelp beds in the ocean near Santa Barbara, CA. They are developing models that quantify the amount of giant kelp with multi-spectral satellite imagery.
Specifically, Cavanaugh uses all bands of SPOT data in his region of interest. All together, he has thirteen dates of data over three years that he is analyzing for this project. The SPOT sensor has 10 meter resolution, and Cavanaugh uses three of its detection bands; their ranges are shown below.
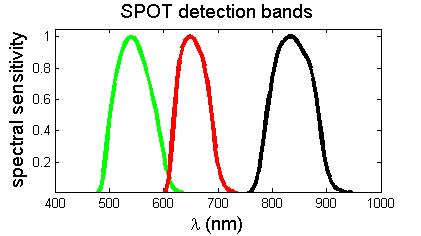
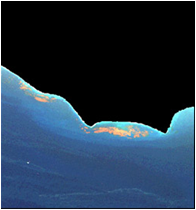
The two short wavelength bands correspond well to standard green and red color. The longer wavelength band, which is near infrared, is useful for kelp detection. This is because kelp's reflectance is similar to water's in the visual band, but is about six times greater in the near infrared band. The entire image processing is illustrated below.
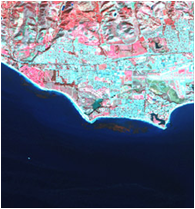
A raw SPOT image is acquired and geographically oriented.
A masked image is created, eliminating the land from the region of interest.
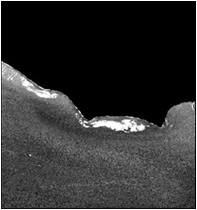
The NIR/green band ratio is computed.
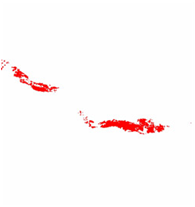
The kelp is delineated using simple algorithms.
The process is performed on each of the thirteen images, creating a time series of the area of kelp canopy in the ocean near Santa Barbara, CA. By comparing this data with "ground truth"--physical measurements of kelp biomass--a model can be developed mapping the satellite data onto the amount of giant kelp. Such a tool would be valuable not only for research, but also for practical application such as fishery management.
Satellites
Education and information
Amazing images
SPOT | Aqua | MODIS | Earth Observing System
Nikon MicroscopyU | SpectralCalc | Dr. Short's Remote Sensing Tutorial
Blue Marble