Bryce Yoshimura
MAT 594cm - Final Project
Final Project: Classical Ising
I have been doing research in a simulated condensed matter group making a program employing the Wang - Landau Algorithm. I wanted to visually see how the lattice changes over time and the appropriate characteristics.
The Wang - Landau algorithm is a Monte Carlo sampling that finds the relative energy densities of a lattice, or grid, over all the energies accessible. The lattice I chose to apply the algorithm to is an Ising model that is a 4 x 4 length in the classical regime. So, once the lattice is defined, we know that at each intersection there will be an electron with an up spin or down spin and the energy:
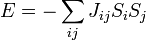
where i represents the nearest neighbor and j is over all lattice sights. Having the energy in mind, all of the possible energies that can be made with the lattice can be caluclated.
Finally, with all of this information about the lattice in place we can look at the Monte Carlo portion of the algorithm which is:
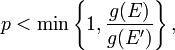
Where g(E) is the current energy density and g(E') is the trial. So the probability of flipping the electron is the ratio of the trial density and the current density compared to a randomly generated number [0,1). Different sites are suggested through a random walk.
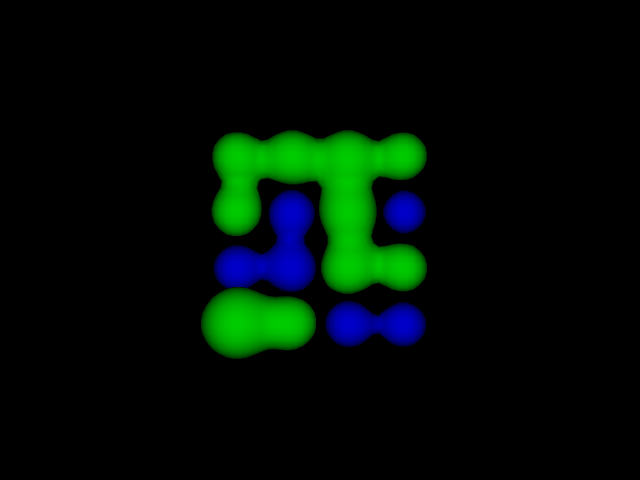
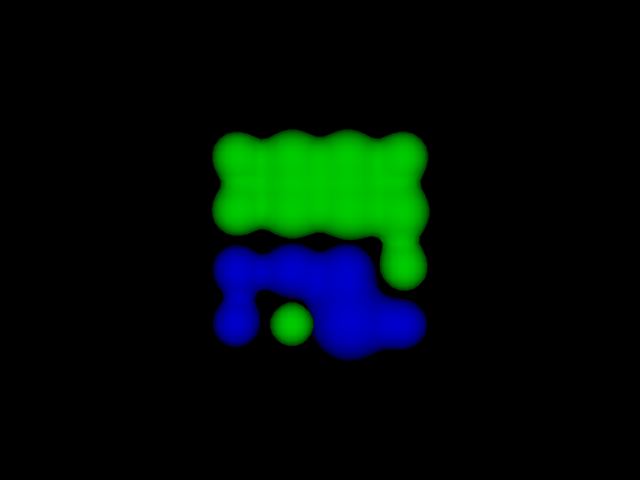
The first visualization that I had employed was to place an isosurface over the electrons in the lattice and offset them according to their spin. The isosurface and the offset were used because when a concentration of similar spinned electrons were present the isosurface would connect them to make a blob like shape. With multiple blobs in the lattice, it would give a sense of the energy density of the lattice. The electrons were then colored green to signify an up spin and blue for a down spin.
A second blob consisting of 5 metaballs to act as agents to show which site was randomly selected.
The way the isosurfaces were created was through the marching cubes algorithm. Through which the space is broken up into a series of cubes and the surface was identified depending on how many of the corners were inside the surface or outside. A look- up table was used to identify the voxels that had to be calculated. After the voxels were calucated, the isosurface is simply displayed by cycling through the appropriate voxels and using a triangle to connect them.
However, as the visualization progressed I did not believe that it had accurately displayed the idea of the algorithm. This inaccuracy was from the isosurface visualization had focused on the interactions of the electrons with its nearest neighbors but the algorithm does not depend upon these interactions. The algorithm is only concerned with the lattice as a whole in which the probability of flipping an electron is wieghted against the whole entire lattice's energy density.
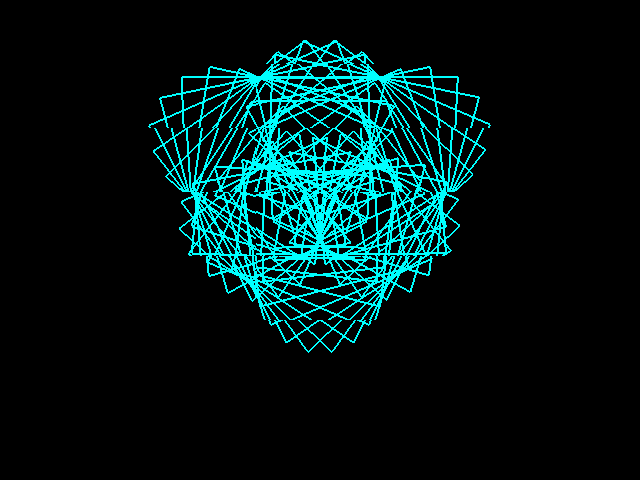
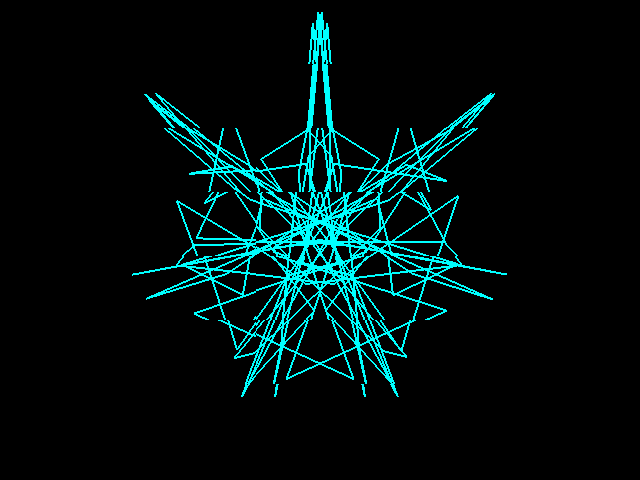
In the new visualization, I employed a Maurer Rose to convey the energies and magneization found by the Wang-Landau algorithm. The Maurer Rose is a concept in which 361 points are defined in polar coordinates by:
r = sin(nk)
k = (0,d,2d,3d,...,360d) (in degrees)
From which the points are connected in their respected order. The reason why I chose to use a Maurer Rose is because the n used to create this rose can be revived. This is from the fact that if n was odd then there would n number of petals and if n was even then there would be 2n number of petals. So by setting "n" to equal the energy density and "d" is equal to the magneization, the energy density could be found from simply counting the number of petals. From which if:
Number of petals was odd -> number of petals = energy density.
Number of petals was even -> number of petals/2. = energy density.
(This is done only because the number of petals can only be an integer.)
The displaying process of the Maurer Rose was simply done by defining the vertices and then connecting them with a line strip. When the Maurer Rose, changes each point in the previous rose is given a velocity toward its new position. And this is repeated for the transition between roses. This was done because each rose has an equal amount of points. The magnetization is oberserved from the mixing of the positive, which is green, and the negative, which is blue.
Although this was a good step, the visualization was still inaccurate. This was because in the Algorithm the probability of the flip is based on the ratio of the new energy density and the old. While in this visualization using a Maurer Rose only the current energy density could be displayed.
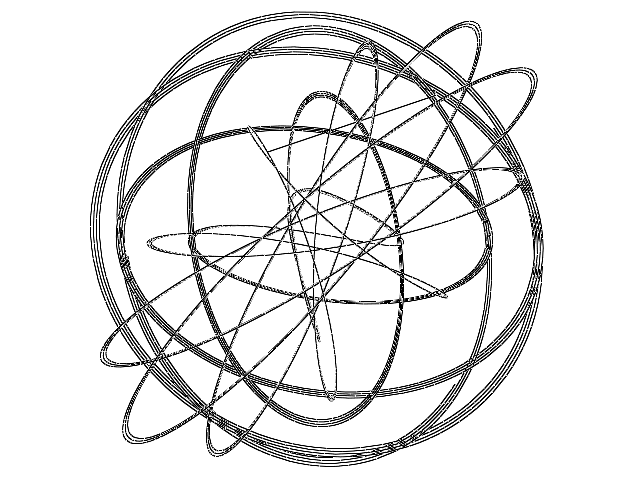
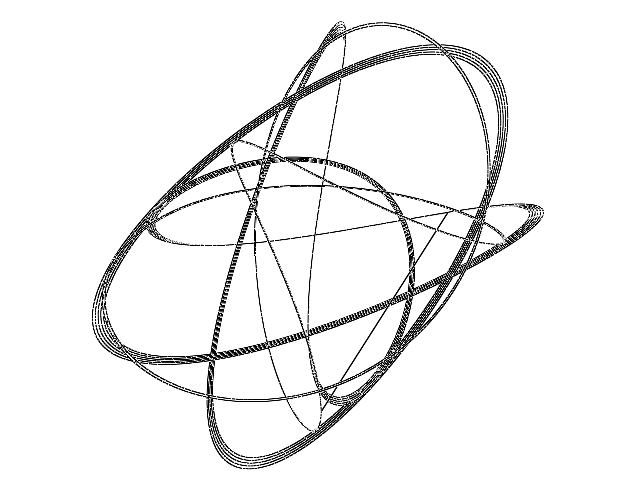
In this last visualization a harmonograph was simulated. The harmonograph is the superpostion of two pendulums acting on a two dimensional plane. Through the use of super-position we simply add together the equation of motion for both pendulums. The x and y equations that we end with is:


The harmonograph provides a direct comparison of the trial energy density with the current energy density. This is done by setting the characteristics of the lattice to specific constants:
d2 = d4 = 1/the trial energy density
f1 = f3 = current magnitization
f2= f4 = trail magnitization
p1 = x postion of last accepted random site
p3 = y position of last accepted random site
p2 = x postion of current accepted random site
p4 = y position of last accepted random site
The harmonograph is displayed by placing vertices into a vector and connecting them together with a line strip. Once the shape is defined a new trial energy density is chosen and the appropriate constants in the harmonograph equations are changed depending on whether the energy density changed or not. Once this new shape begins the old one begins to be erased.
Future improvements for the visualizations:
1) Apply the visualization to a 3 Dimensional lattice
2) Adding sound to hear the changes to histogram of the energy density that were visited.
Wang-Landau Algorithm article
Marching cubes article
Maurer Rose article
Maurer Rose article
Harmonograph article
Just the source code: source.zip