
IMAGES |
 |
Title TBA Antje Jackelin |
 |
Rereading the landscape: Death, redemption, and resurrection on a Greek Island Martha Henderson |
 |
Enduring Metaphysical Impatience? Robert Ulanowicz |
 |
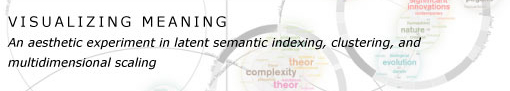
Aggregate Visualization Jenn Bernstein |
Inspiration
This past fall, I was a research assistant for a cross-disciplinary program entitled "New Visions of Nature, Science, and Religion", directed by Master's thesis adviser, Jim Proctor. One of the objectives of the program was to see if a diverse group of scholars could work through their individual disciplinary perspectives to collaborate towards a shared vision of nature. Having heard a little bit about information visualization from my former professor Sara Fabrikant, I decided to enroll in this course to see if visualizing information could facilitate this goal.
"Data"
The scholars have been working on writing individual essays towards the compilation of a collective volume. I decided to visualize a few of the draft essays to explore my methodology.
The first step was to choose my essays. Because the essays were in draft form, there was some diversity as to format, length, and completeness. I chose essays that were relatively complete and contained an abstract. I then cleaned the essays, eliminating titles, topic headings, and footnotes.
Objective
I wanted to create two types of visualizations. The first was of each individual essay: within each essay, I wanted to show the dominant concepts, and the relationship of those concepts to one another. The second was of the essays overall: I wanted to show how the different essays related to one another.
Methods
There are many different approaches to analyzing similarity between essays. Simple keyword searches are often used, but I decided against this option for a few reasons. Different words represent similar concepts, and one word may represent many concepts. I was also concerned about stemming, when a keyword search wont identify words with the same prefix but a different suffixes. I decided to use Latent Semantic Indexing (LSI) to create a similarity matrix. Latent Semantic Indexing looks at co-occurences of words to remedy with the above concerns. If I were to query a database with a particular keyword using LSI, I could theoretically retrieve a document that doesn't contain the queried word, but rather words that have shown to be associated with that word based on the system's previous knowledge of word association. 
LSI begins with creating a term-document matrix, wherein the terms are on one axis, and the times they occur in each document is on the other. An implicit component of this part of the process is deciding what a "document" is. A document can be a sentence, a paragraph, or an entire essay. I first tried to use individual sentences, but after clustering the sentences (more on clustering later) I found that they grouped themselves up by paragraph pretty well. Not much of a surprise- sentences within a single paragraph would be talking about similar concepts, right? So I decided to use paragraphs as my "document" of analysis.
To create this term-document matrix, I was turned on to the "Text-to-Matrix" generator, distributed by Zeimpekis and Gallopoulos out of Greece. It is a free, third-party Matlab add-in that makes LSI relatively simple to execute (note that the GUI does not work on a Mac, however). The TMG comes with a list of stopwords that make what will inevitably be a sparse matrix a little less sparse. You are given a variety of options in creating this matrix. I used "emptyline" to separate my documents, and the common_words dictionary included with the add-in. After some experimentation I used term frequency as the local term weighting, inverse document frequency (IDF) as the global term weighting, and applied stemming. IDF is supposed to accommodate the fact that some words will be used frequently between many documents, and will not help us differentiate between them. I experimented in "muscling" my way into a similar result by finding the most frequent words in each essay and adding them to the common_words dictionary, but found that the result was nearly identical to the IDF function.
After creating the matrix, the general practice is to use Singular Value Decomposition (SVD) to reduce the sparsity. SVD is a type of factor analysis that produces three matrices (U, S, and V). The diagonal values of S are the singular values we are interested in. Because factor analysis is a means of reducing dimensionality, you choose the number of dimensions to include based on how much of the information they capture. Traditionally, this is done through creating a scree plot of the eigenvalues and cutting your dimensions off at the "elbow", or where a distinct drop-off in information capture is visible.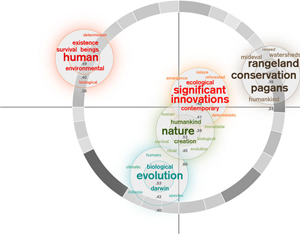
You are then left with a reduced matrix of similarity between documents, but it still isn't ready to visualize. To determine similarity, I decided to use a clustering algorithm to mathematically group the paragraphs. Not knowing much about clustering, kmeans seemed to be a standard technique for this type of data. I experimented with the numbers of clusters I chose, and for the final visualizations chose between 5 and 8 clusters. There are benefits and drawbacks to the numbers of clusters you use- too many, and you don't come to any generalizations, too few and the result is less nuanced. There were some other problems with the clusters as well. It seemed that some included 1 or 2 highly specific sentences, and then other large clusters into which a lot of "misc" was dumped. I tried to choose the number of clusters based on whether they made sense intuitively.
I still hadn't technically done any Latent Semantic Indexing, however. After wrestling with Matlab for awhile, I decided to use a site maintained by CU Boulder to perform the LSI. I took each cluster and turned it into its own "document", and then used Boulder's "near neighbors" function to extract the words most related to the cluster. I chose "General Reading up to First Year College" and my dictionary, asked to return 10 terms, and used log entropy weighting. Note that the output, once again, does not work on a Mac. This created a term set for each cluster, and told be how related each term was to the document overall.
The other nice thing that the LSA @ Boulder site does is create a "Matrix Comparison" of a set of documents. I used the same dictionary, and entered my "documents" (clusters) into the space. This resulted in a similarity matrix. 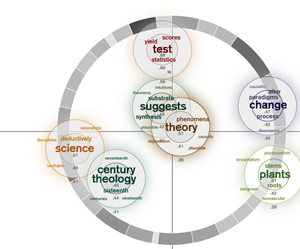
I then took this matrix to SPSS, a statistical analysis program, to create a visualization of the similarity of the clusters. To do this, I used multidimensional scaling, a factor analysis technique somewhat similar conceptually to SVD. I had to doctor up the dataset a little first by subtracting the values in the similarity matrix from 1. This is because MDS uses distance to represent similarity, and the most similar documents have a higher value in the similarity matrix. Hence, if the raw matrix was plotted, the most similar documents would be furthest away.
Visualizations
I created all visualizations using Adobe Illustrator, occasionally using Adobe Photoshop to resize and crop images.
Individual Essays
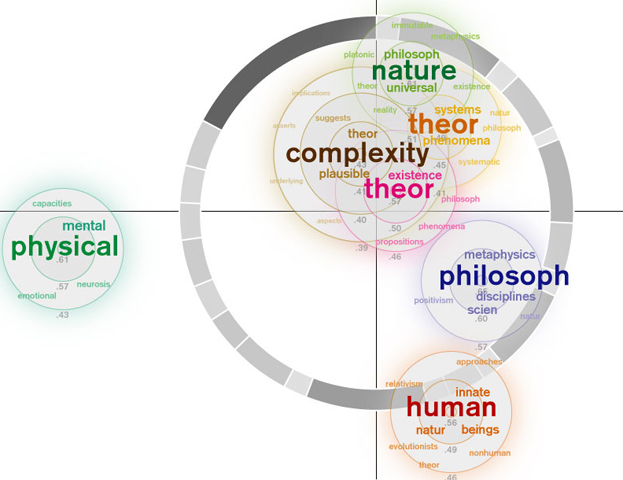
My first visualization took the arrangement of the clusters as determined by MDS and centered the related word that resulted from the "near neighbors" function on the centerpoint of each cluster. Because some clusters had words very related to them and others didn't, I decided to make the word arrangement relative to each cluster rather than the relatedness of the dataset as a whole. I used a qualitative color scheme to assign a color value to each cluster. I changed the term font size and color saturation based on its relatedness to the cluster as a whole. I also eliminated words with a similar stem (the Boulder site does not apply stemming) and words that I subjectively decided were irrelevant.
During my mid-quarter feedback, Prof. Legrady said my visualization looked somewhat sparse. Inspired by components of the munterbund site, I decided to add a visual component that showed something about the essay structure. I created a grayscale ring that represented paragraph length through both arc length and saturation. Longer paragrahs have longer arcs and are darker. The ring is centered on the (0,0) coordinates of the MDS cluster distribution.
Collective Essays
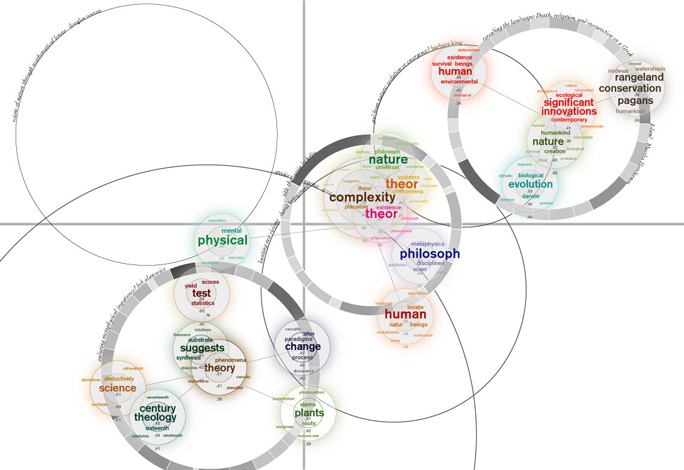
To create the collective essay visualization, I took the abstracts of the essays that contained abstracts and visualized their distribution using the matrix comparison/MDS method described above. I then took the individual essays that I visualized and centered those visualizations on the centerpoints of the abstract placement. I also scaled the grayscale rings to represent essay length. This way, there is a micro/macro reading of the book- you can look at the distribution of concepts within the individual author, as well as their relation to the group overall in terms of concept and length. The empty circles labeled with an essay title and author's name are essays that I haven't yet visualized individually.
|
|
|
|
Title TBA |
Rereading the landscape: Death, redemption, and resurrection on a Greek Island Martha Henderson |
Enduring Metaphysical Impatience? |
Aggregate Visualization |
Reflections
My thoughts about visualizing text changed significantly throughout the course of this project. I came into the project believing that the visualizations could serve as a summary of the essays, which in retrospect was extremely naive. The process through which you visualize text is subjectivity disguised as objectivity. It is far from an automated process. So many choices must be made- the different global and local weightings, the number of dimensions to preserve from your SVD eigenvalues, your choice of clustering method, the dictionary you use to extract related words. All these choices change your output substantially. Of course, an essay is not infinitely malleable, and regardless of your decision, some relationships will be preserved regardless. But these relationships are the obvious ones, which begs the question whether the visualization is needed to extract these relationships at all. I think that types of text that semantic analysis is good for must be both large and diverse. While I though there was a high diversity of views within this book, it is not diverse is a bigger sense. The authors are compiled in a single volume, and are participating in a single program. This is an implicit type of similarity that I didn't think of when I began the project.
I think that visualizing information works best when the information is quantitative. I think that natural language processing has its merits, but it is not very effective in capturing meaning. Throughout the course of this project, I came to believe that we have numbers and text for different reasons, and one is not interchangeable with the other. That said, I think that these visualizations should be appreciated as art, not science. They should be appreciated for what they can contribute, but not relied on as a superior method to reading the actual essays and thinking critically about them.
Future Work
I have a variety of things I would like to do in another iteration of visualizing this dataset. Some of these are as follows:
- After generating the text matrix, eliminate words that occurred only once to find more nuanced relationships
- Try different clustering techniques
- Create my own common word dictionary from relevant academic journals
- Do multiple iterations of clusters and overlay the visualizations, with the terms inversely scaled by number of clusters
- Try relating the texts purely by keyword, eliminating the LSA
- Determine what prominent qualities of each text assign it its location on the x and y axises of the MDS
- Try the Pathfinder algorithm for the final visualization
- Overlay the aggregated similarity matrix visualization with a similarity matrix of perceived relatedness, as stated subjectively by the participants themselves
- Create the aggregated similarity MDS through Matlab, using the entire documents rather than just the abstracts
- Find words most associated with the individual words from the near neighbors analysis, and create another micro-level reading
- Think more about ways to decide what determines significance. Often, length is used as a proxy for significance, which poses conceptual and methodlogical problems
- Think more about how to normalize for document length. This is more challenging that it may seem.
References
Websites
http://www.munterbund.de/visualisierung_textaehnlichkeiten/essay.html
http://lsa.colorado.edu/
please see Visualizing Information homepage for more references that I could list here...
People
George Legrady, Angus Forbes, Jim Proctor, Alex Villacorta, Stacy Rebich
Publications
Baeza-Yates, R. and B. Ribeiro-Neto (1999). Modern Information Retrieval. Essex, England, Addison Welsley.
Balbi, S. "Visualization Techniques for Non Symmetric Relations."
Berry, M. W., S. T. Dumais, et al. (1995). A Case Study of Latent Semantic Indexing, University of Tennessee.
Corman, S. (1999). Extracting Knowledge from Communication: Prospects for Machine Interpretation of Conversations and Texts. Annual Meeting of the International Communication Association. San Francisco, CA.
Dennis, S. (2004). "An unsupervised method for the extraction of propositional information from text." PNAS 101(suppl. 1).
Fabrikant, S. I. and B. Buttenfield (2001). "Formalizing Semantic Spaces for Information Access." Annals of the Association of American Geographers 91(2): 263-280.
Fabrikant, S., and Skupin, A. (2005) Cognitively Plausible Information Visualization. in: Exploring GeoVisualization, Elsevier.
Hoffman, T. (1999). Probabilistic Latent Semantic Analysis. Uncertainty in Artificial Intelligence, Stockholm
Kruskal, J. and M. Wish (1978). Multidimensional Scaling. Beverly Hills, Sage Publications.
Landauer, T., D. Laham, et al. (2003). From paragraph to graph: Latent semantic analysis for information visualization. Mapping Knowledge Domains, Irvine, CA.
Skupin, A. and Hagelman, R. (2005) Visualizing Demographic Trajectories in Attribute Space. GeoInformatica.
Skupin, A. (2004) A Picture from a Thousand Words. Computing in Science and Engineering.
Skupin, A. (2004) The World of Geography: Mapping a Knowledge Domain with Cartographic Means. Proceedings of the National Academy of Sciences.
Wall, M. E., A. Rechtsteiner, et al. (2003). Singular value decomposition and principal component analysis. Berrar, D.P