stacy rebich
I chose to visualize the contents of a recently-published National Research Council report on spatial thinking in K-12 education. I had a variety of reasons for choosing this particular work for the project. First of all, I have been working on a project related to teaching spatial thinking, and I was interested in exploring the contents of the book. Furthermore, I knew I would have access to a digital text version of the book since the ebook was available for purchase. Finally, I wanted to do a project that would result in a visualization that could be put on the web and used as an access point to the text itself. Since the full contents of most NRC reports are made available online in PDF format, I knew I would be able to link viewers to a stable version of the book online.
The first step in preparing to visualize the contents of a book is to convert the actual text to a term-by-document matrix. TMG, a Matlab toolbox created by Dimitrios Zeimpekis and E. Gallopoulos of the University of Patras, is a great tool for performing this first step. It is freely downloadable, and includes a set of functions for performing Latent Semantic Analysis as well. To generate my matrix, I divided the book into 199 sections based on the subsections designated by the book's authors.
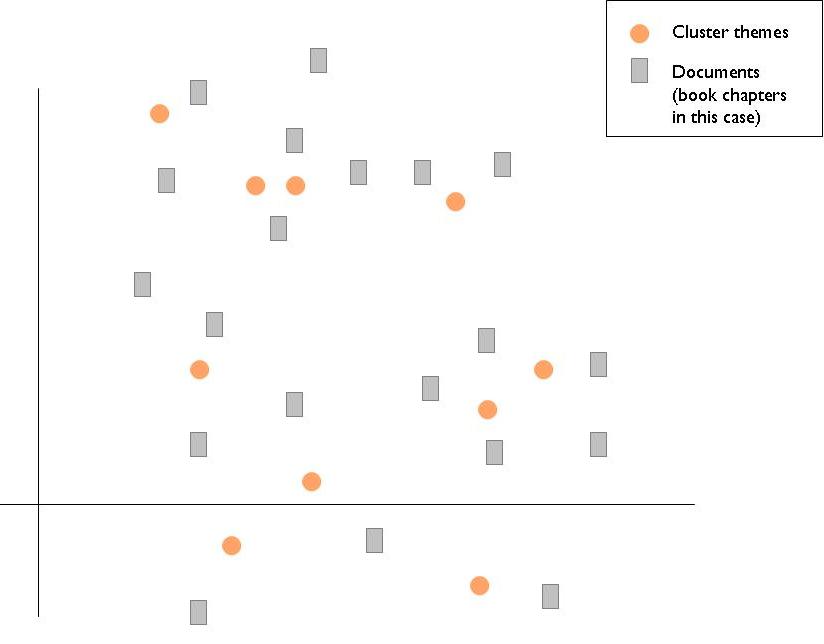
Naively, at the beginning of the course, I was hoping to generate a representation of the meaning space of the book that could look something like this. I was hoping to identify some common themes (NOT simply keywords) and then map out the relationships between these themes and each section of the book. As you will see, this turned out to be a very daunting task, and the search for meaning continues!
the search for meaning using latent semantic analysis
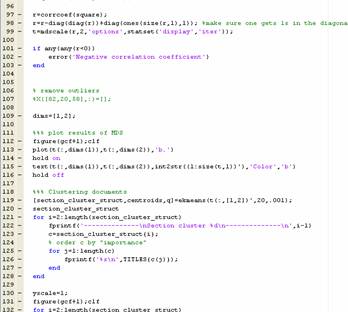
My original plan was to use LSA (Latent Semantic Analysis - also known as Latent Semantic Indexing) to identify the main themes in the book. I read several research papers on the topic and perused a variety of websites to find information that would provide some guidance about how to make all of the necessary decisions. I chose to perform the analysis using Matlab since the functions were included in the TMG download.
LSA basically involves singular value decomposition (SVD) of the text-document matrix, and then use of the first n (often 2) singular values and correspoding eigenvectors to reconstruct a 'thematic' representation of the semantic space. More information about this technique is available in some of the papers I reference below. A good basic overview can be found on the Wikipedia latent semantic analysis page.
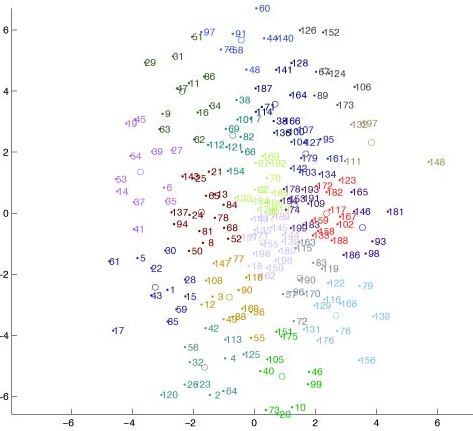
After many attempts at choosing the correct parameters for latent semantic analysis, I was still getting images like this one. Although it looks better than many of my first attempts (because I used multidimensional scaling (MDS) on the similarity matrix output through LSA), the cluster representations that I was producing didn't seem to make much sense.
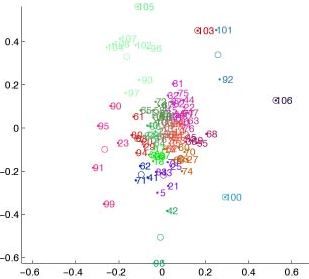
I also tried to use LSA and MDS to represent keywords and documents in the same semantic space. I tried several methods of normalization, but nothing I did was able to really put the 'themes' and the book sections in the same meaning space. In this representation, all of the numbers above 90 are keywords or phrases, and you can see that they all end up around the periphery of the cluster.
change of plans: the use of Kohonen's self-organizing map algorithm to create a representation of the book's semantic space
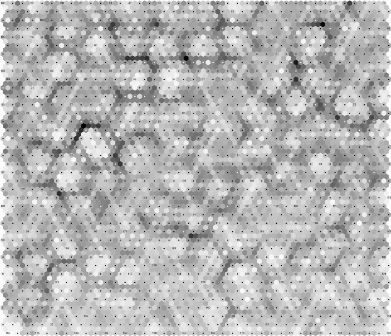
Even though I initially chose not to use the self-organizing map (SOM) algorithm because 1) I wanted to extract 'themes' rather than keywords and 2) I wasn't attracted to the graphic output that doesn't use distance between objects to represent semantic distance between them, I wasn't getting anywhere with visualization of the LSA results. I began experimenting with Kohonen's SOM, and the grid on the left is the standard graphic output from SOM_PAK 3.1 from the analysis I used as the basis for the representations that appear in my final project.
You may notice that I used a large number of grid cells for a relatively small number of objects (199). I made this decision based on advice from Andre Skupin, who uses a large number of grid cells to prevent objects from stacking on top of each other. I also 'overtrained' the map, since the book sections constitute a closed set. To be more specific, I preferred to have a representation that accounted for as many of the small relationships between sections as possible, rather than a representation that would be suitable as a basis for identifying the correct 'location' for other documents outside the training set. My inputs to create the SOM representation were a 40X40 hexagonal grid; 100,000 training iterations at learning rate = .04, radius = 30; 100,000 tuning iterations at learning rate = .02, radius = 5.
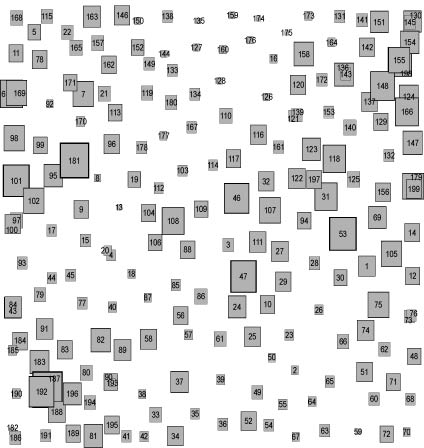
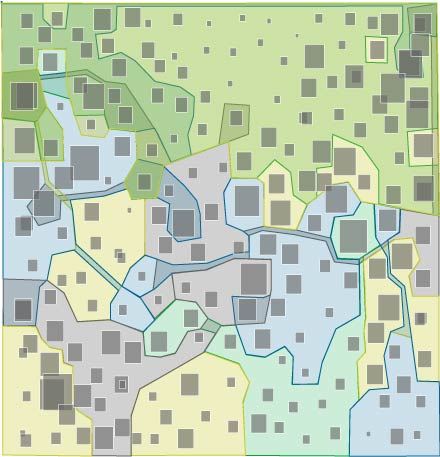
This is a re-representation of nearly the same information represented above. Andre Skupin, while he was here visiting, gave me some help with getting my SOM outputs into ArcGIS so that I could use the spatially referenced visualization capabilities of this geographic information system software. To the original SOM outputs, I added information about the length of each book section to create the proportionally-scaled rectangles shown here.
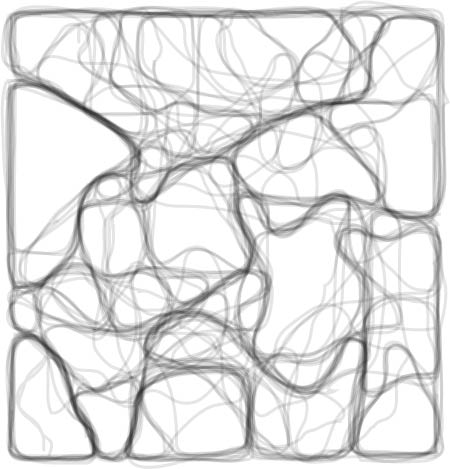
Once I had arrived at the SOM-based spatial layout for the book sections, I began the search for meaningful groups of sections for which I could identify the 'themes' I had been seeking. I used multi-iteration k-means clustering to generate cluster solutions for 12, 13, 14, 15, 16, 17, 18, 19, and 20 clusters. In Illustrator, I drew lines around the clusters generated in this way and stacked them on top of each other to produce this image. As you see, some boundaries between clusters are quite stable regardless of the number of clusters chosen, while others seem to change. In my first pass at meaningful clustering, I used the darkest lines in this representation as a guide for my cluster boundaries.
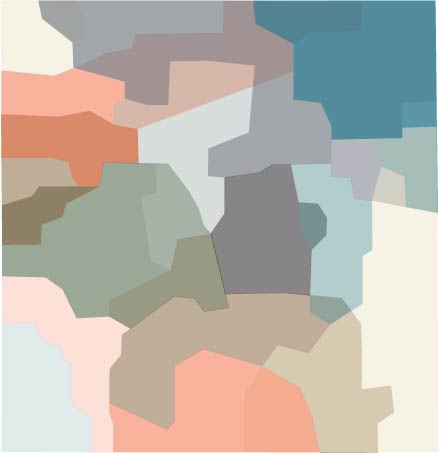
Based on what I have read in the book and on the titles for each section, I 'subjectively' created these clusters. I associated one 'theme' with each cluster. Notice that many clusters overlap each other.
After further encouragement from Prof. Legrady to identify my clusters through algorithmic means, I ended up with a cluster solutions that look something like these. Notice here, once again, that I have overlapping clusters. These clusters were generated by using the cluster centroids for the 12-cluster k-means solution. To decide which documents should be in each cluster, I set a distance threshold, and all sections that fell within that distance from a centroid are considered as part of that centroid's cluster. As is apparent here, a number of documents belong to 2 or more clusters when cluster membership is calculated in this way.
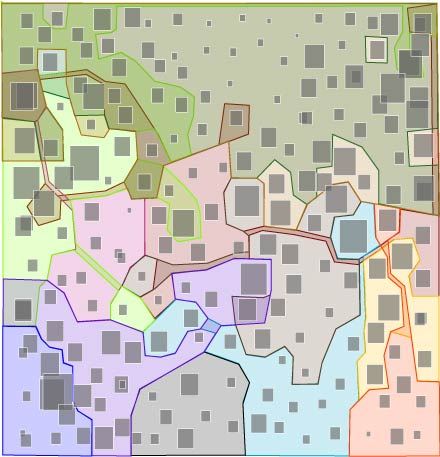
This representation is identical to the one above, except that each cluster has a unique color. Although I think the above representation is more aesthetically pleasing, I realized that I needed unique cluster colors for the interactivity I was planning to include with the online version of my project.
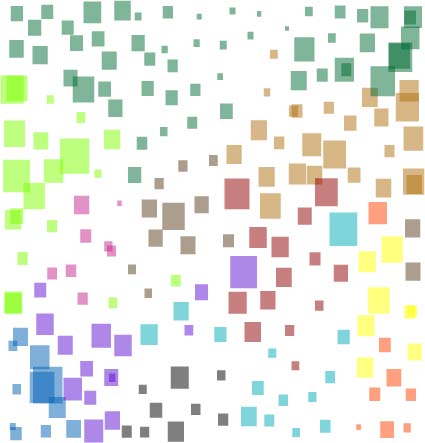
The creation of the above representations allowed me to make some interesting observations. On the left, you can see the basic k-means 12-cluster solution, where each section falls into only one cluster. Compare this representation with the one below.
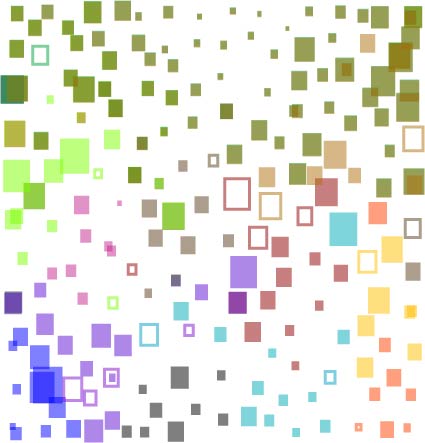
This shows the same 12-cluster solution, except that in this representation I used the distance threshold to assign cluster memberships. In this representation you can see that while the green and beige clusters that occupy a large portion of the space in the above representation, here they overlap almost completely, indicating that they are very close together in 'meaning space'. Also notice the hollow sections, which are not part of any cluster when defined by the distance threshold. Their borders are colored according to the cluster centroid that they are closest to. I feel that adding this sort of cluster information to the visual representation makes up (to some degree) for the fact that space is somewhat distorted in the SOM outputs. This way of representing the space could help the viewer imagine that each cluster occupies the same amoung of meaning space, even if they occupy different amounts of representation space. What is still missing is some representation of the distances between non-overlapping clusters.
Latent Semantic Indexing Web Site http://www.cs.utk.edu/~lsi/
LSA @ CU Boulder http://lsa.colorado.edu/
T.K. Landauer, S.T. Dumais, A Solution to Plato's Problem: The latent semantic analysis theory of acquisition, induction and representation of knowledge.