MAT 594 - 2008S
DA Boy - Paint by Algorithm
description
The goal of this project is to have a computer algorithmically compose an image. I do this in a conceptually simply way:
- The computer "learns" what an image looks like, and creates a representation of it's understanding.
- It composes a new image based on that understanding.
For example, if the computer "believes" that images have many small features with minor color variation, then it would create an original image with these properties.
overview
In this project, I design an algorithm that uses local information to create realistic images.
- Local information: When determining the value of a pixel, the algorithm only considers neighboring pixels.
- Realistic: This could
mean many things, but I will gauge how realistic an image is with two
questions:
- Using summary statistics or other quantitative metric, does the created image resemble "real" images?
- Does the image look like an image? When you look at it, is it like looking at a cloud where you can pick out features and sometimes find animals and vegetables, or looking at modern art and finding form and meaning? Does the image cause the viewer to see something?
For this project, I tried two different techniques for
image creation. One was based on a Markov chain, and the other was
based on cellular automata in the style of Schelling's segregation
model. Both used a database of probabilities computed from actual
images to actually build an image. For the Markov chain algorithm, the
training data provided transition probabilities. For the segregation
model algorithm, the training data provided each cell's decision
criteria.
Markov chain model
The first generative algorithm I developed used Markov chains to construct images. I was inspired by Markov parody generators for text, where transition probabilities are computed based on existing text. A transition probability is the chance that the system will transition to a state given its current state. In the context of text, it is the chance that a certain word will come next given the current word. To create a parody, the generator is provided or picks a possible state (the first word) and it randomly--based on the transition probabilities--generates a new state (the next word). By recording each state (word) as it occurs, an entire passage is constructed. Such generators tend to create blocks of text that are nonsensical but nevertheless "sound right".
To construct transition probabilities for an image, I took a base image (e.g. the two satellite images below) and counted how many times a certain intensity value was adjacent to another. For example, I looked at a pixel whose intensity was 100 and recorded the neighbors' intensities, which were 99, 96, 101, and 100. I then did this for all the pixels whose intensity was 100, getting a list of all the values that abutted 100 in the entire image. I could map these frequencies onto probability and use them as transition probabilities in a Markov chain.
To actually create an image, I put a random intensity value in the top left and, based on the transition probabilities, create its neighbors. This serves as a nucleation point, and the rest of the image is built pixel-by-pixel from there. This results in a directionality, because a given pixel is computed from the states of the pixel above and to its left. I could changed the method to have information propagate from a different source in a different direction--or even from multiple sources in multiple directions--but the spatial propagation of information is a feature inherent to the method and can't be easily removed.
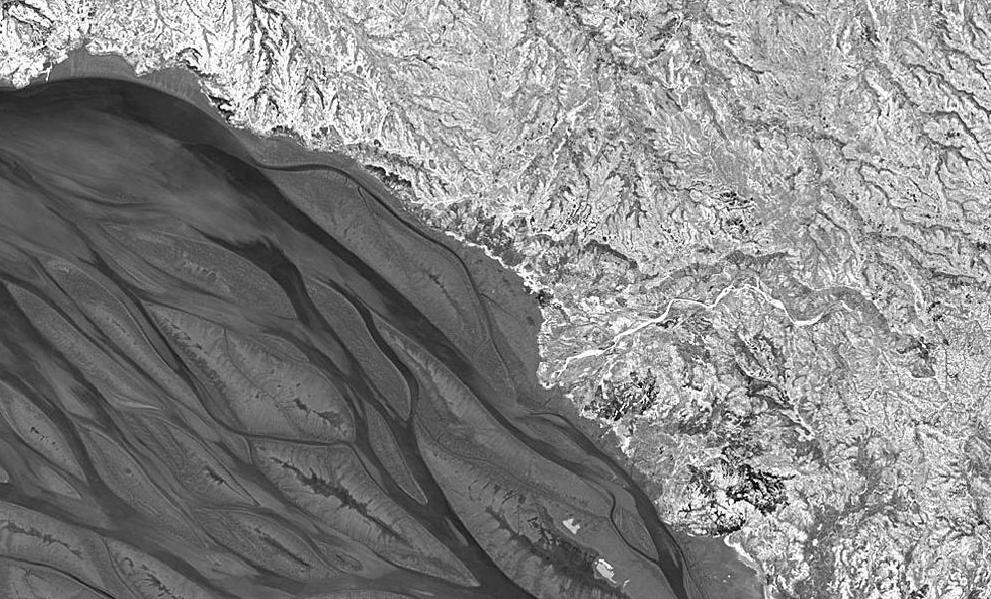
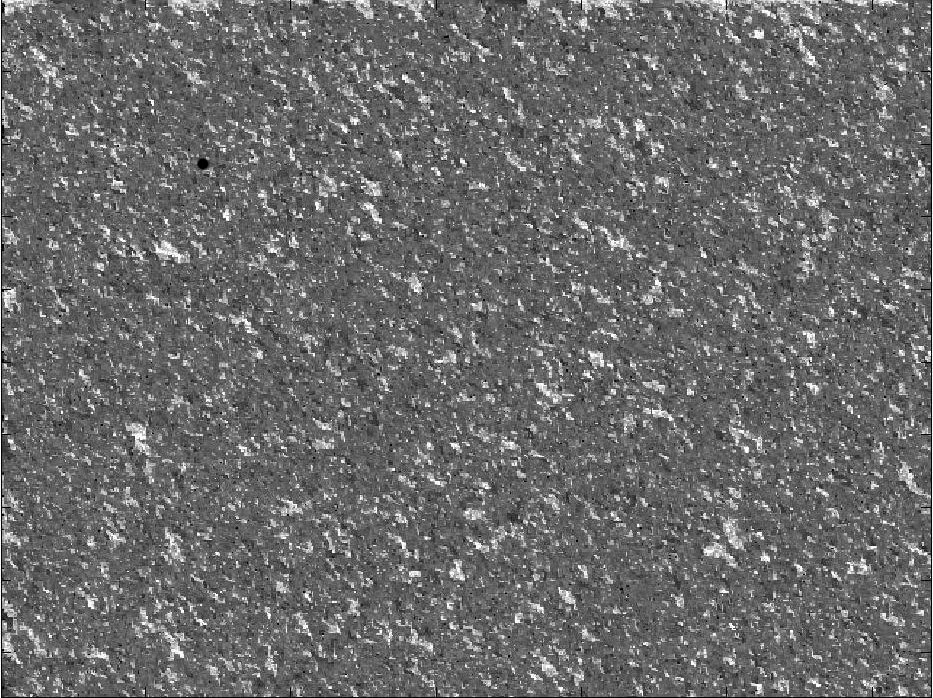
In
the above set of images, the top image was used as a training set to
generate the bottom one. The algorithm created some interesting small
features, but it failed to create mid- or long-range order.
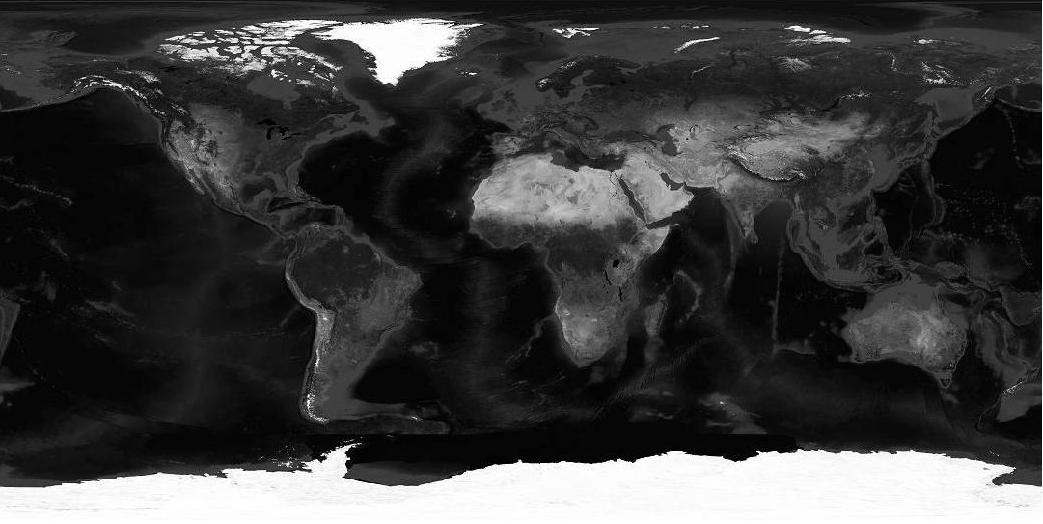
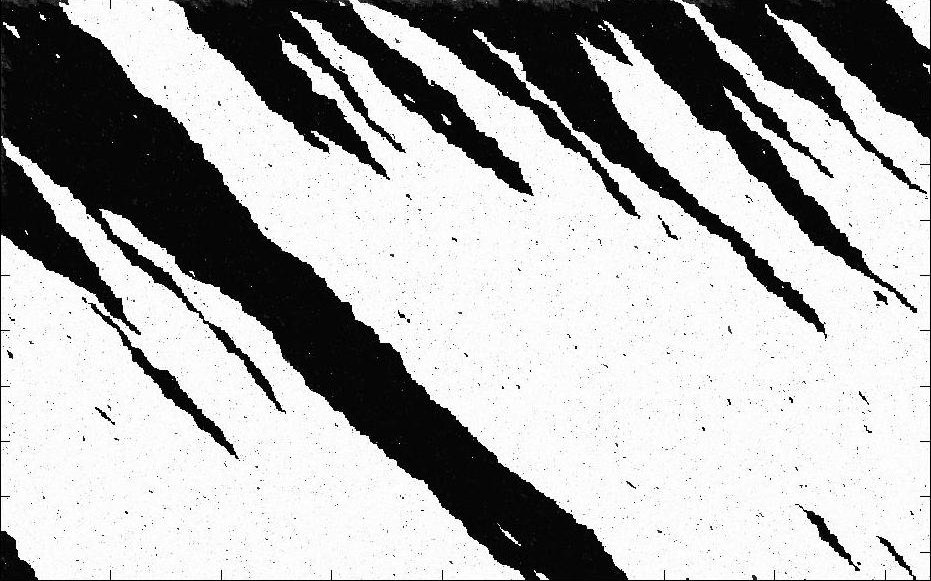
In this second set of images, the algorithm generated
large, cohesive
features, but failed to create any fine detail. Also, the propagation
of
information from the top left towards bottom right is a dominant
feature of the image.
segregation model
The shortcomings of the Markov chain model led me to consider an algorithm that did not have a directional flow of information. Given that I wanted to use local information, cellular automata was like a natural choice. Schelling's segregation model is a classic example of emergent patterns from local decision making. The idea is that each cell "wants" to be near other cells similar to itself (or doesn't want to be surrounded by cells unlike itself) and can move to achieve this. Even if cells' preferences are minor, then over time the cells aggregate into distinct, homogeneous groups.
For my model,
pixels don't directly use "sameness" as the criteria for evaluating
whether it is better to stay or move. Rather, they use probabilities
calculated based a source image in a method similar to calculating
transition probabilities for the Markov chain model. In this case, two
cells are selected. They "look" at their neighbors, and if they
"prefer" to switch, then they do, where "prefer" means that the sum of
the probabilities is higher in the switched positions.
I started with a black and white image of an apple (per George Legrady's suggestion). To initialize the image, I generated a random field of intensities with approximately the same frequencies as the intensities of the original image.
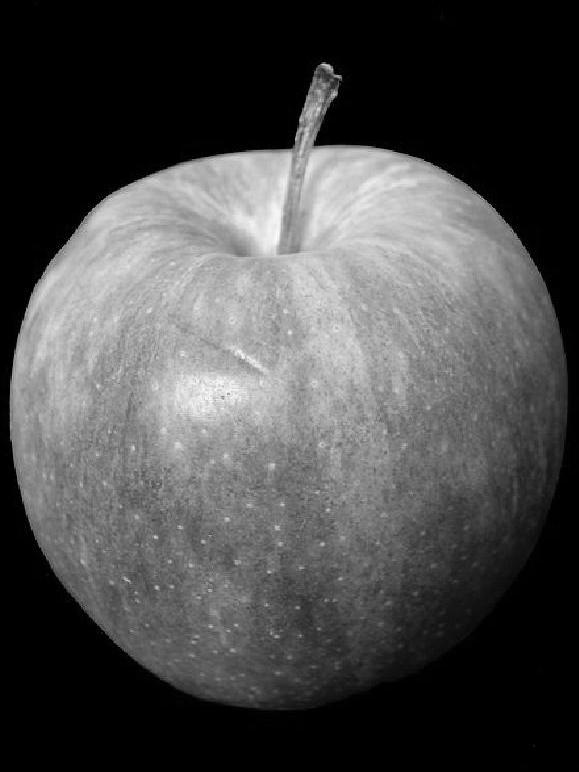
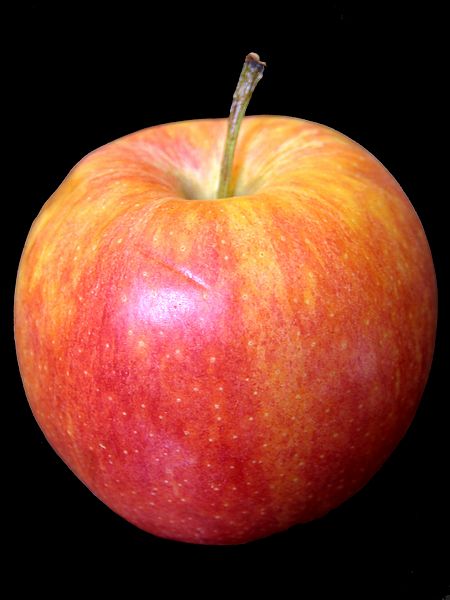
This is the original
apple image used for determining cell preferences (the original image
is on the right; the intensity valued image is on the left).
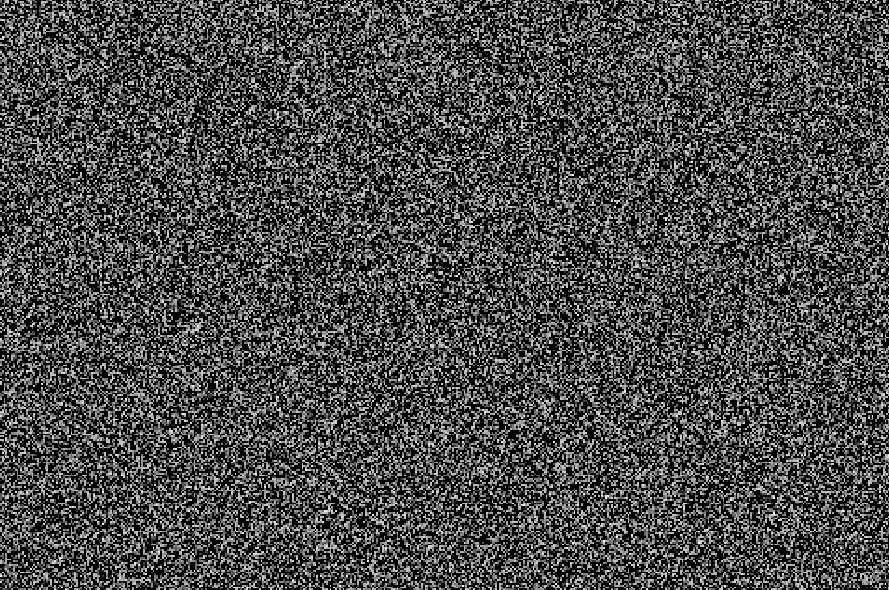
This is the randomly generated image that serves as an
initial condition for the algorithm.
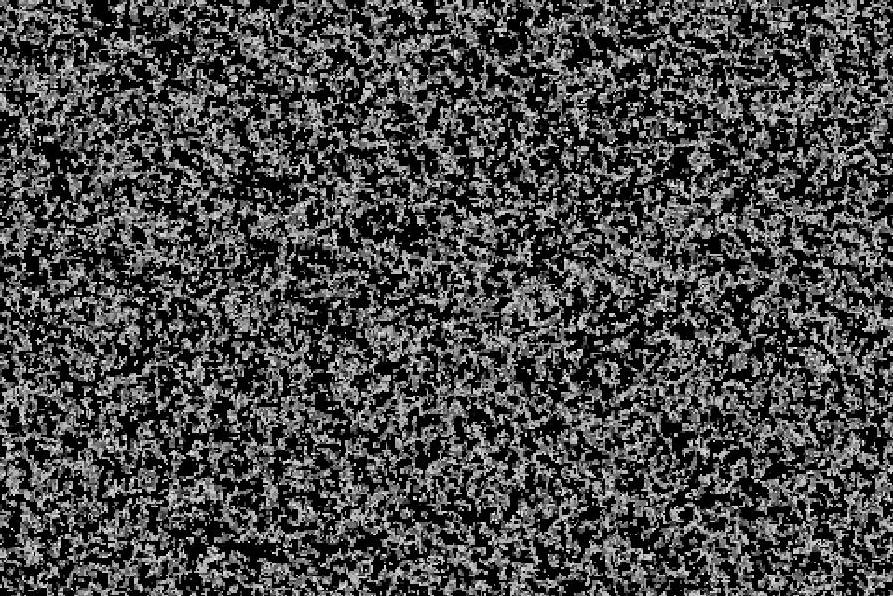
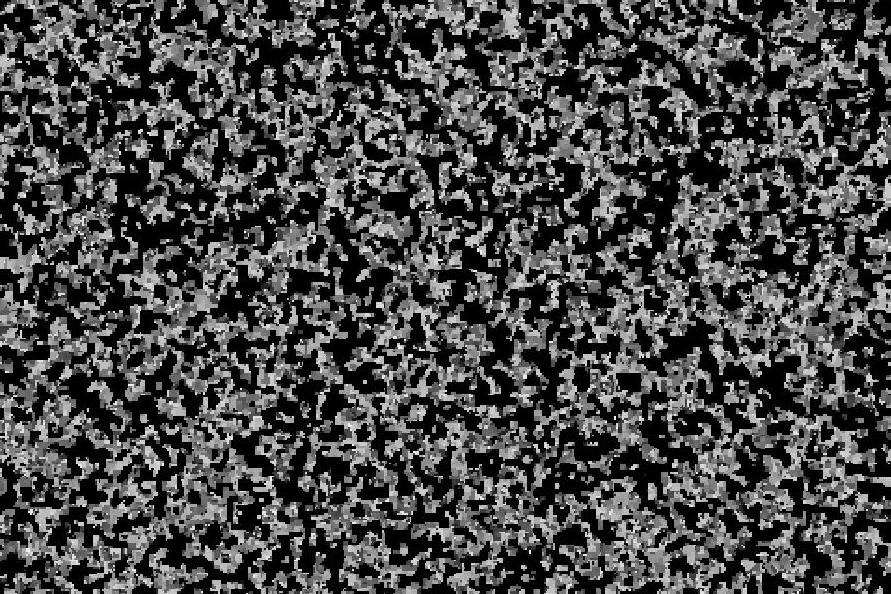
This
is a generated image after about one million time steps. The
intensities have come together somewhat, but the image still looks more
like television static than a piece of fruit.
This is a generated image after about ten million time
steps. By now,
the image has clearly started to find an order.
I extended the segregation algorithm to color to see if there would be any sort of interesting coalescence and created the image set below. I ran the segregation algorithm on each color component separately for about ten million steps and created the images below. The bottom image is what each component looks like separately. Alas, I got interesting confetti, but only minor insights on the algorithm. The conclusion from this experiment was that the color values shouldn't be computed independently.
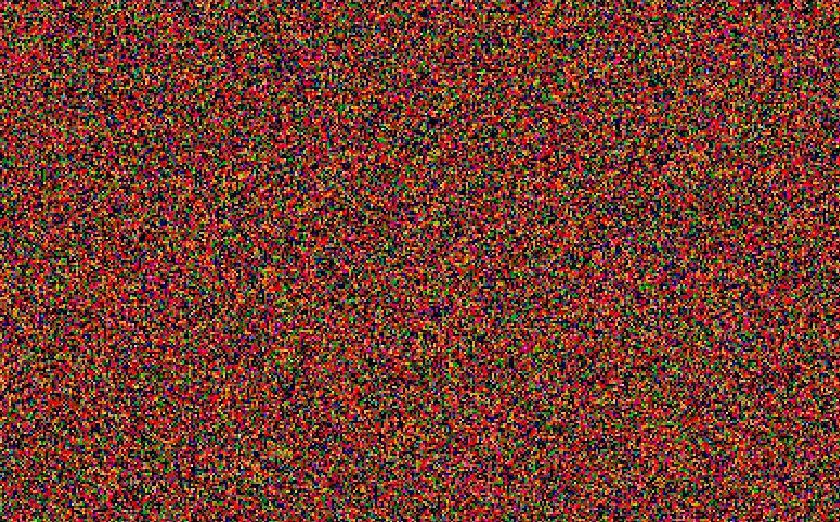
This is the randomly generated image that serves as an
initial condition for the algorithm.
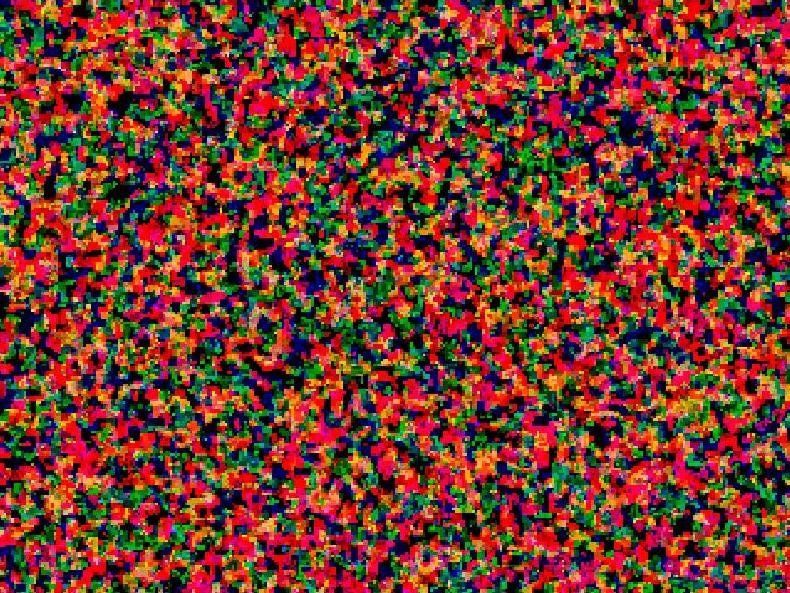
This is the image after about ten million iterations.
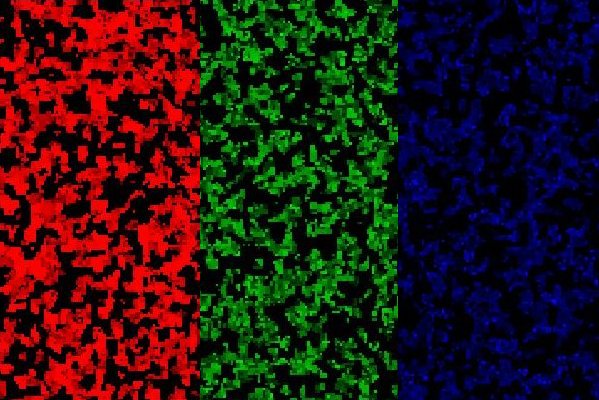
This is what each color component looks like. There is
a lot of red and not much blue, as one may expect from a picture of a
red apple.
To check the dependence on color, I used an image with similar characteristics, except with a different main color. The results were about the same, except it is surprisingly difficult to tell that the source image was largely yellow. Once the colorbands are uncorrelated, then all the frequency of colors is based on the frequency of the underlying RGB values, not any underlying structure of the image (e.g. that there is a banana in it).
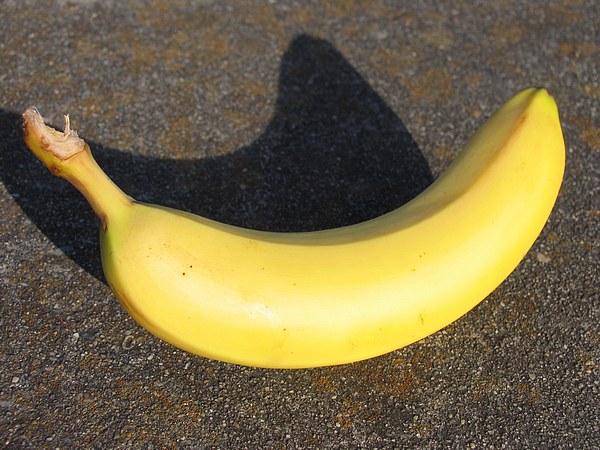
This is the original
banana image used for determining cell preferences.
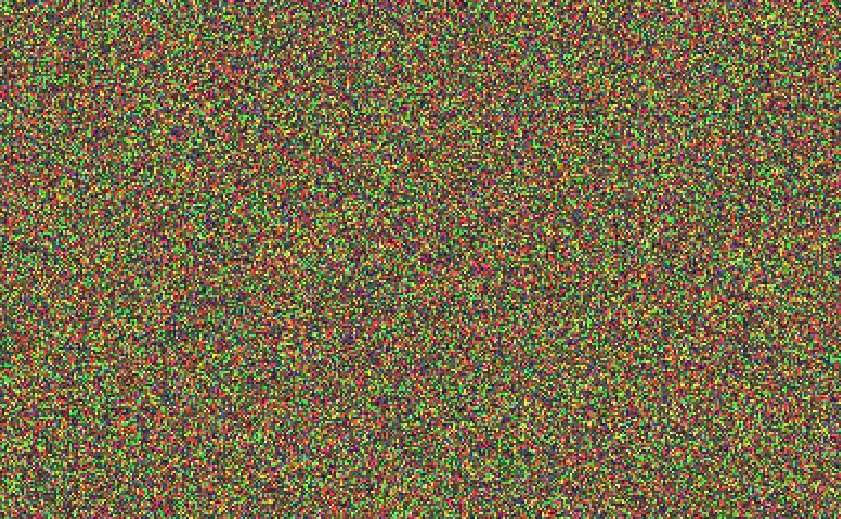
This is the randomly generated image that serves as an
initial condition for the algorithm.
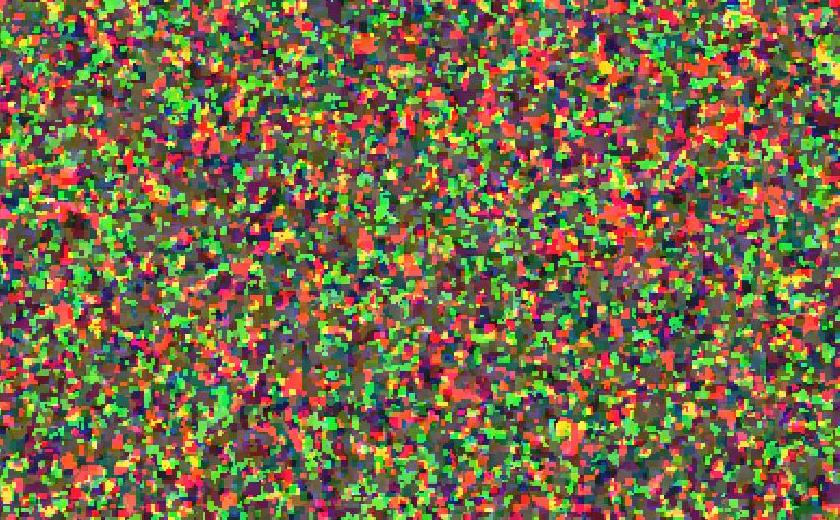
This is the image after about ten million iterations.
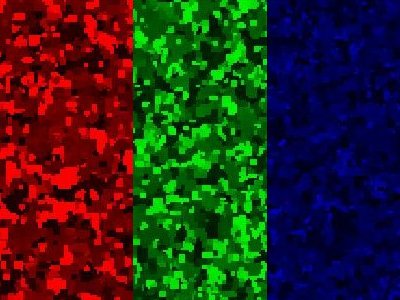
This is what each color component looks like at 3x.
A lot red and a lot of green make a lot of yellow!
RO Duda, PE Hart, DG Stork. Pattern Classification. Wiley-Interscience. 2000.
CM Grinstead, JL Snell. Introduction to Probability. American Mathematical Society. 1997.
TC Schelling. 1971. "Dynamic Models of Segregation". Journal of Mathematical Sociology 1:143-186.