
- Content of graph
- Books - check in January 02.2008 and check out in December.
- Content description of the graph
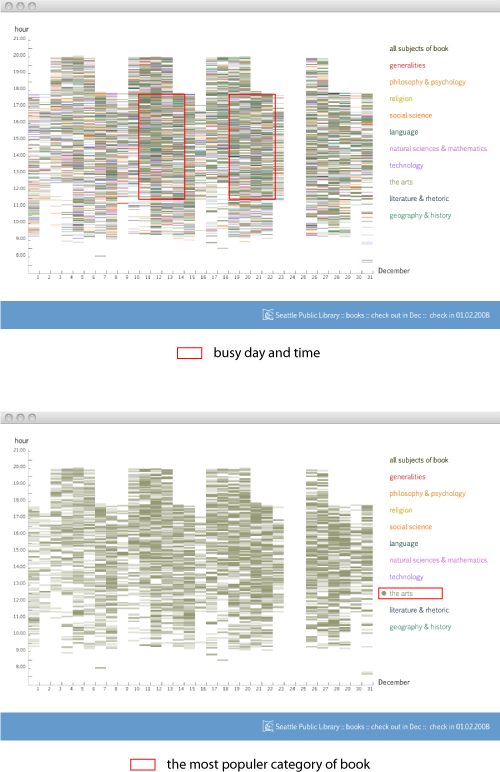
- User can see in what days and hours the library was busy.
- User can see what subjects were more popular among books in the month of December.
- List of data
- checked in January 02.2008
- checked out Decemner 12.2007
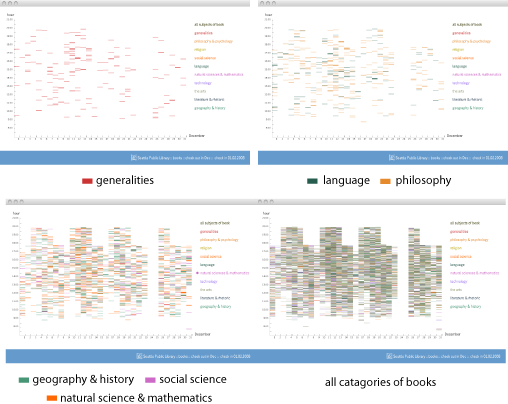
- cetegories
- Generalities
- Philosophy
- Religion
- Social Science
- Language
- Natural Science & Mathematics
- Technology
- The Arts
- Literature & Rhetoric
- Geography & History
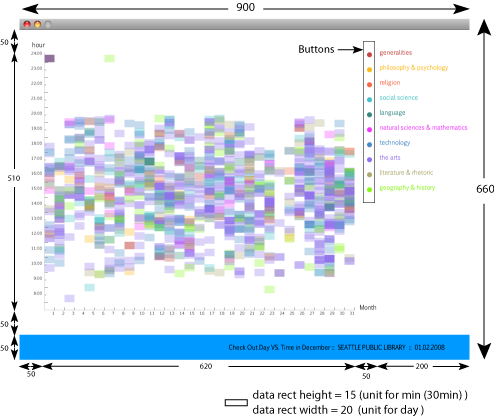
- What formal elements did I use in my data representation?
- line - to show the vertical and horizontal segments of the grid of the graph
- rectangular - to show the data representation
- short segments - to show the unit of days (unit for time - 30 min, unit for day)
- color - used 10 different color to differentiate the categories of subjects
I choose these color according to the standard used by the Seattle Public Library website). Each color has 80 level of alpha. In fact, since some books were borrowed in the same time and day, I represented them using a darker color there where more books were checked out. So the richness and transparency of a color will be changed depending on the number of book that were checked out in the same time and day. - buttons - to give the choice of what data to represent
- Labels
- Horizontal - days
- Vertical - times line
- Bottom - title of this data
- Right side of panel - button for each categories of books
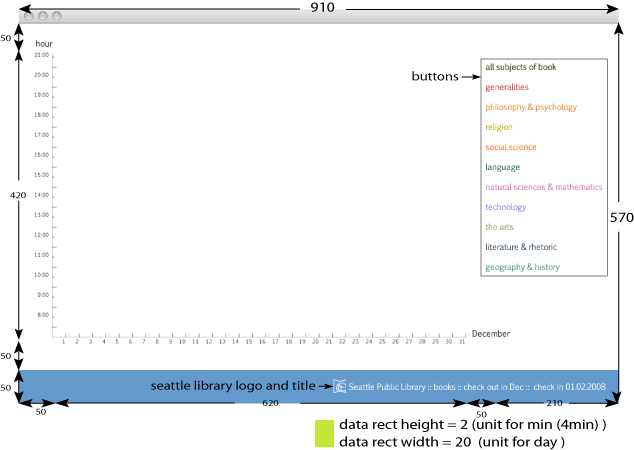
Progress of Developement
- Version 1
-
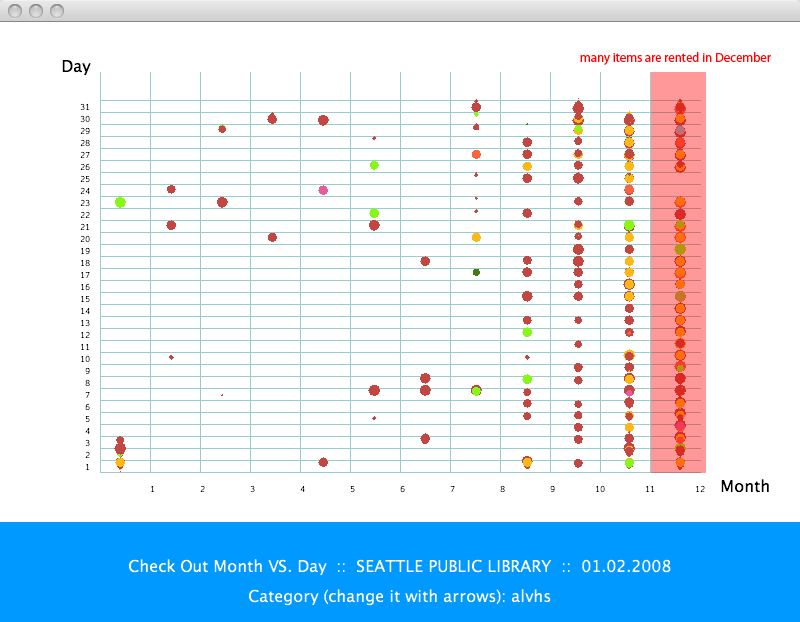
check out month vs day :: check in 01.02.2008 14 pm
- Version 2
-
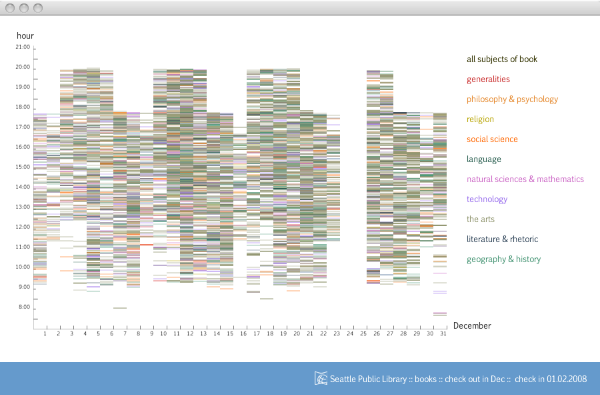
check out hour vs day in Dec :: check in 01.02.2008
- Final Version
-
check out hour vs day in Dec :: check in 01.02.2008
-
- Download Code
- download seattlelibrary.zip
- visit seattle library data