MAT 259 Final project
Self-Mining Data
Problem Statement
One problem often encountered by individuals dealing with large datasets, is that without knowing the characteristics of the data there is no ideal way to mine it, and without mining the data there is no ideal way to obtain it's characteristics.
By allowing data to organize itself and providing adjustable higher-level tools, there is the potential not only to visualize the data, but to obtain a starting point for further investigation.
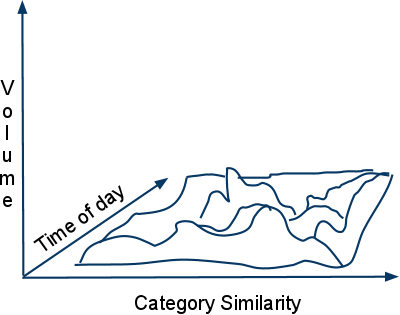
Data with dimensionality higher than two or three presents unique problems. On paper it is possible to represent information in two spacial plus one or two additional dimensions (2+1 or 2+2). In a three dimensional space it is possible to represent data in three spacial plus one or two additional dimensions (3+1 or 3+2).
In my personal experience, mostly gaming, the human mind does not intuitively grasp most representations of three dimensional data. It is my opinion that this is related to how we interact with the world around us. We can manipulate objects in three spacial dimensions, but we can only move ourselves in two. If we are required to move ourselves through more than two spacial dimensions, it is easy to get disoriented. Even though our world is three dimensional, we navigate it in a 2+1 manner (Back/Forward, Left/Right + Height).
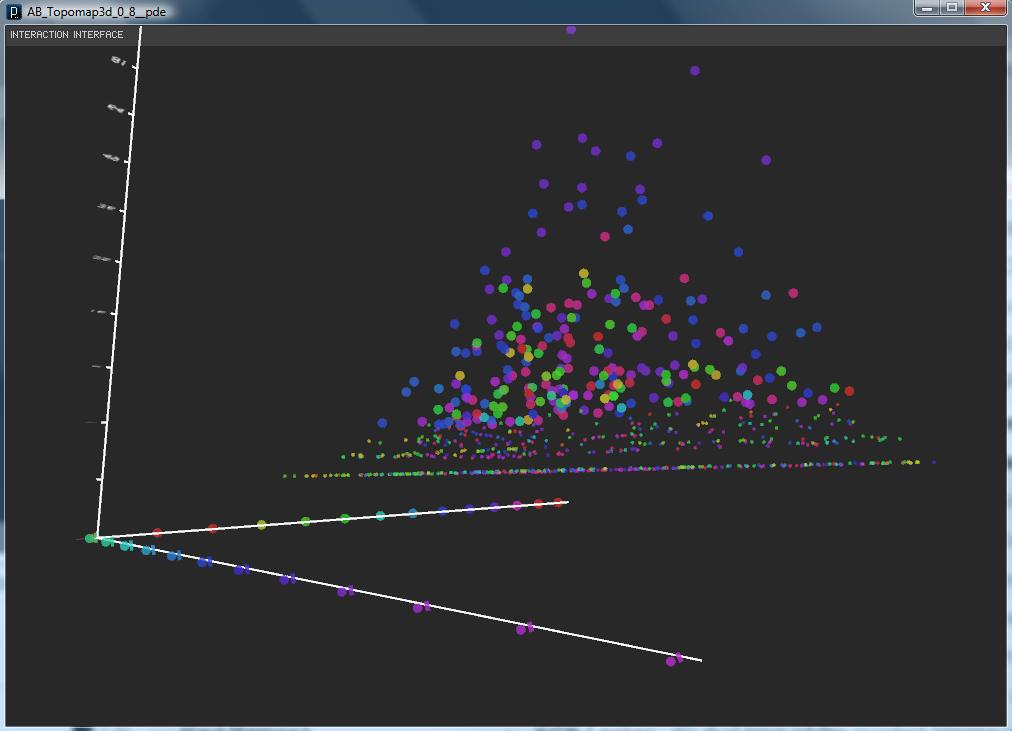
The solution I adopted was to treat the Z-Axis as an additional dimension rather then a navigable one. To do this, I adopted the visual metaphor of topography: it is my observation that terrains are intuitively grasped and that we navigate a surface without becoming disoriented. Color was also introduced as an additional dimension. By toggling between two color schemes, data is presented as a 2+3 space.
Development
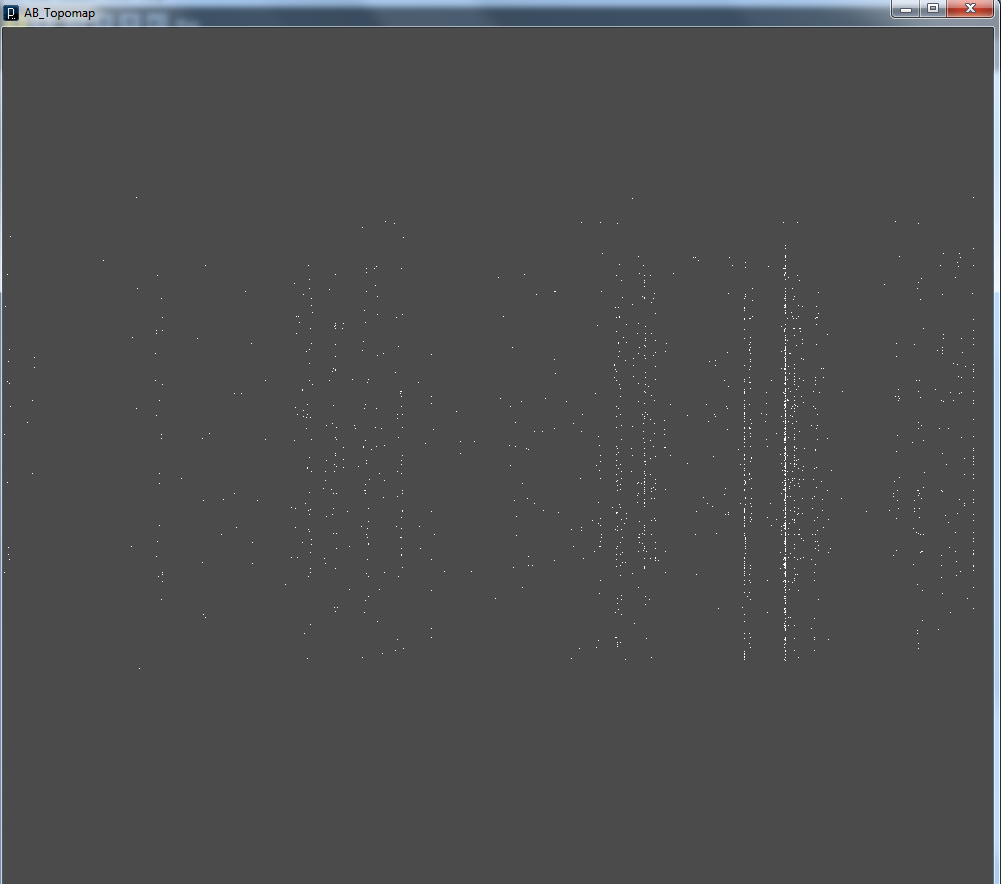
Underlying Scatter plot
Early simulations, Exploring the different forces.
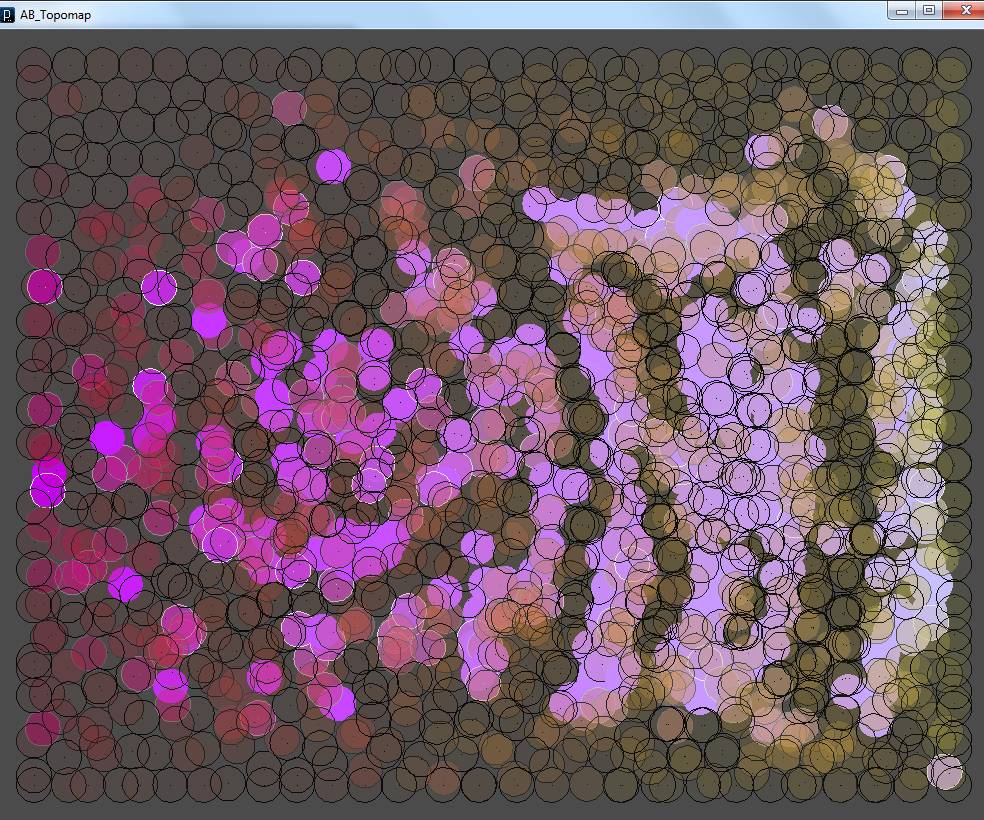
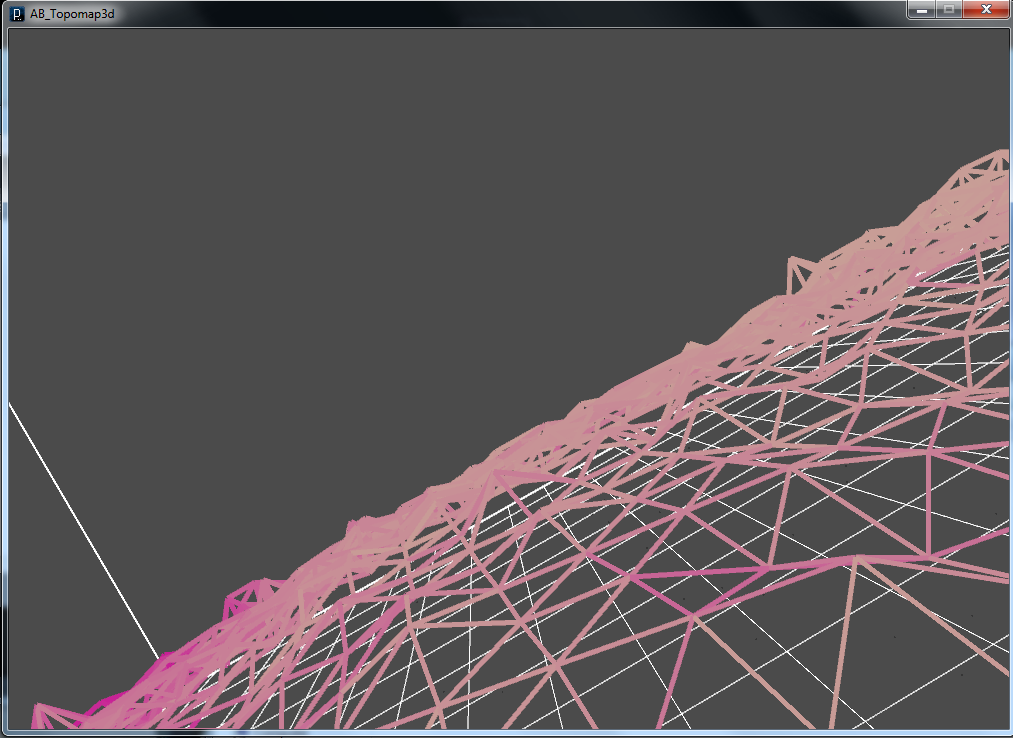
Moving to a surface metaphor.
Some more experiments.
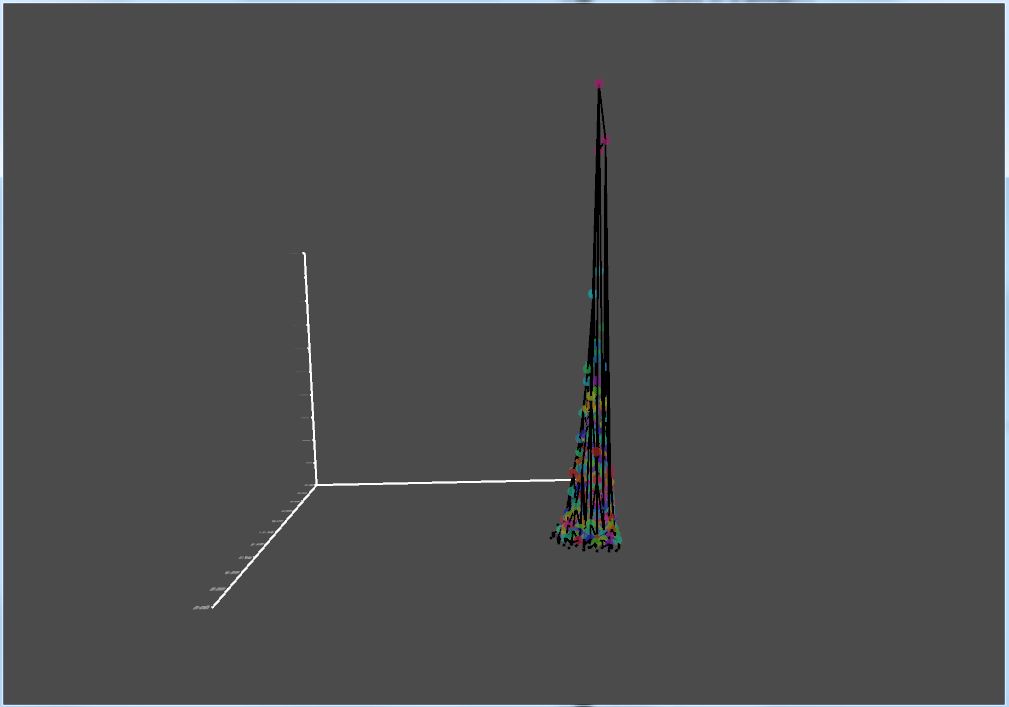
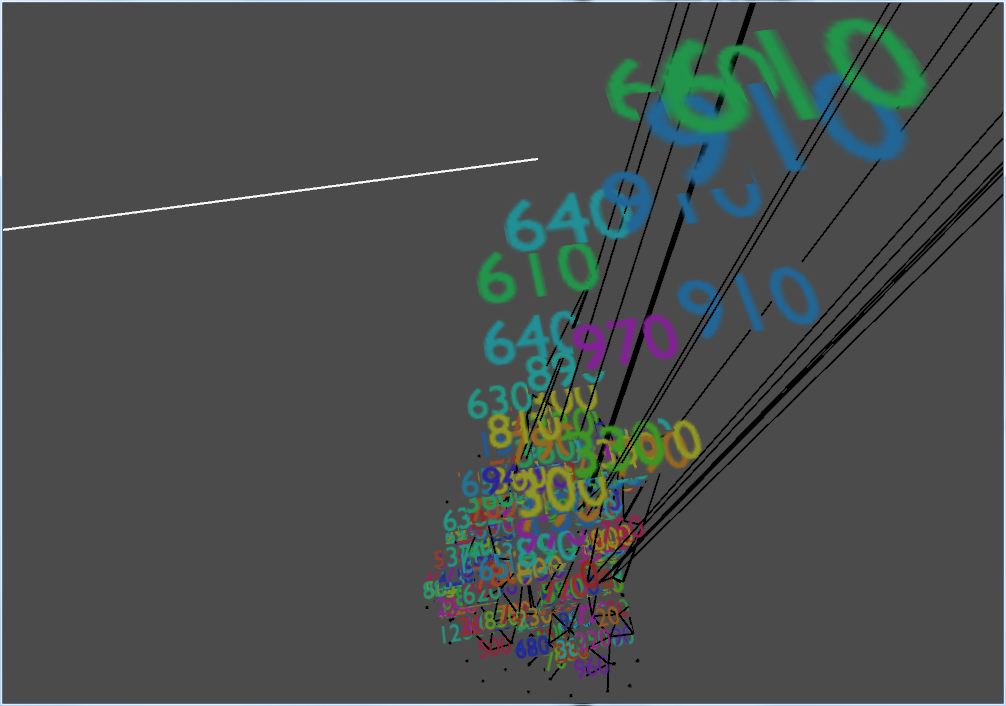
If the forces don't balance.
Tower of Deweys
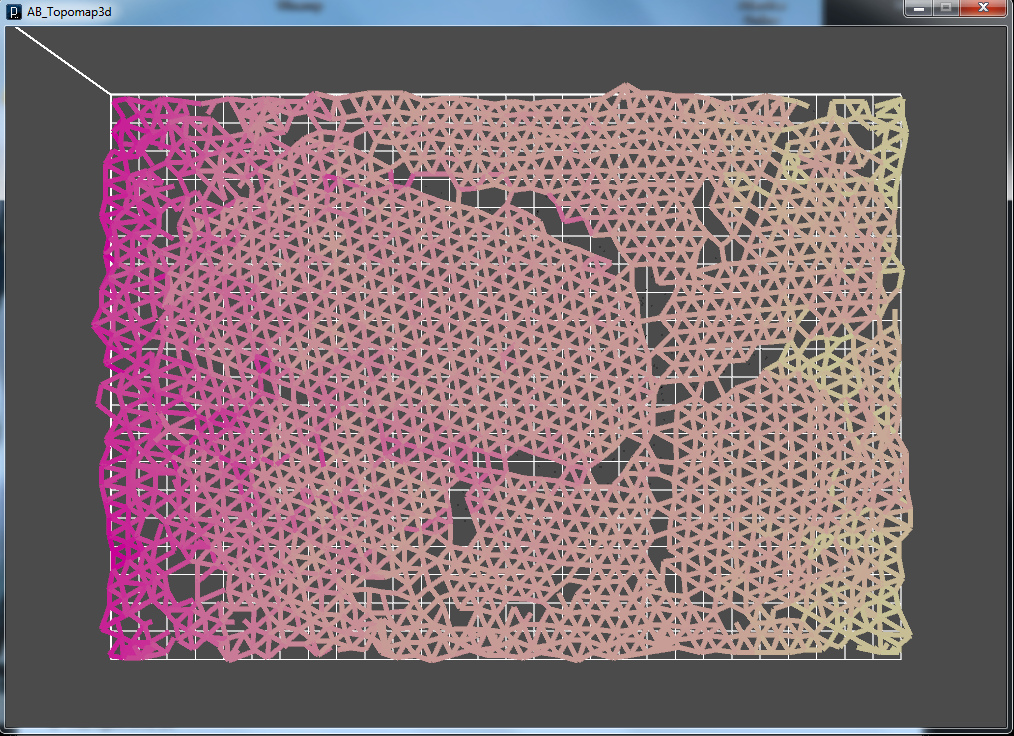
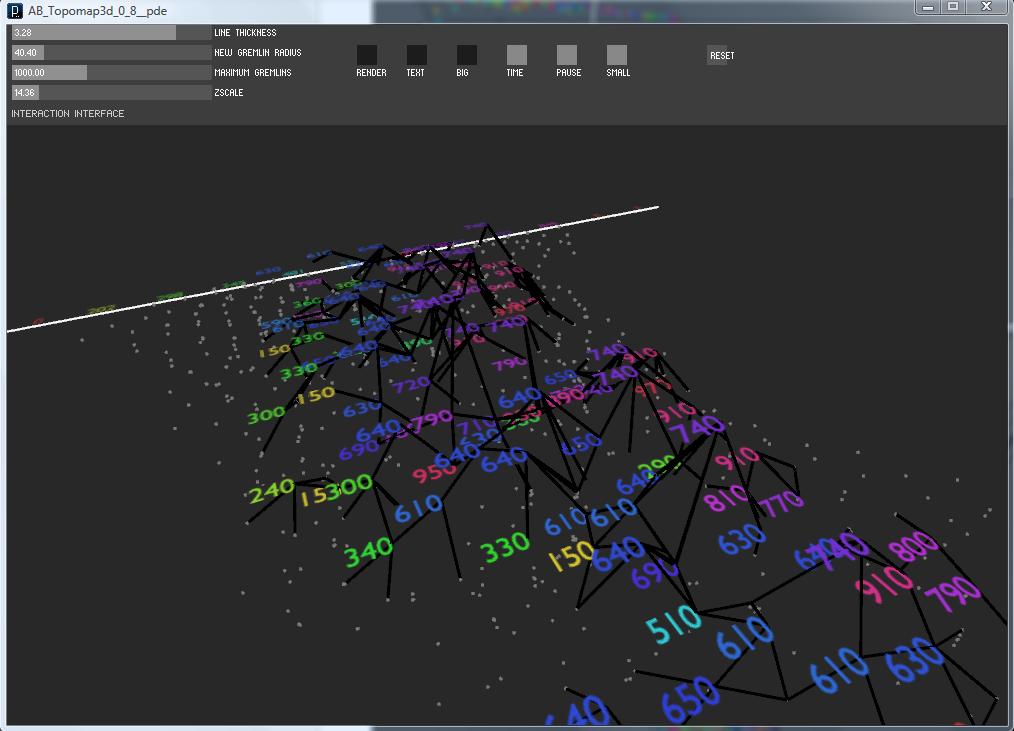
Final version
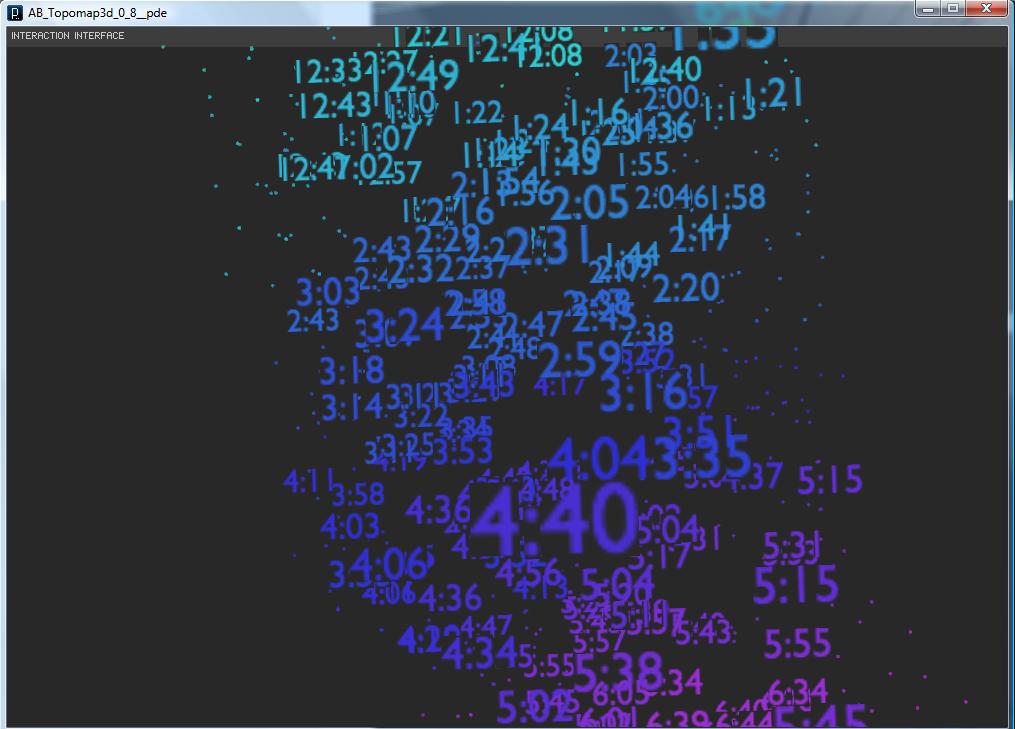
Getting a feel for the numbers