Visualizing the emotions of Twitter in realtime.
Ben Alun-Jones / MAT 259 - Information Visualization
Concept
Information sharing is increasingly becoming faster paced and, it could be argued, more sentimental. Twitter is symptomatic of this change. People 'tweet' their feelings about their daily activities, the lastest news or their relationships. These feelings can be categorised into six 'core' emotions - love, anger,surprise, joy, sadness and fear In keeping with the online feel, these are then displayed as emoticons. Furthermore, research shows that people tend to be far more open online than they would in real life, revealing something closer to their true emotions. This visualisation attempts to display these 'real' emotions at the moment they are announced to the world.
Screenshots
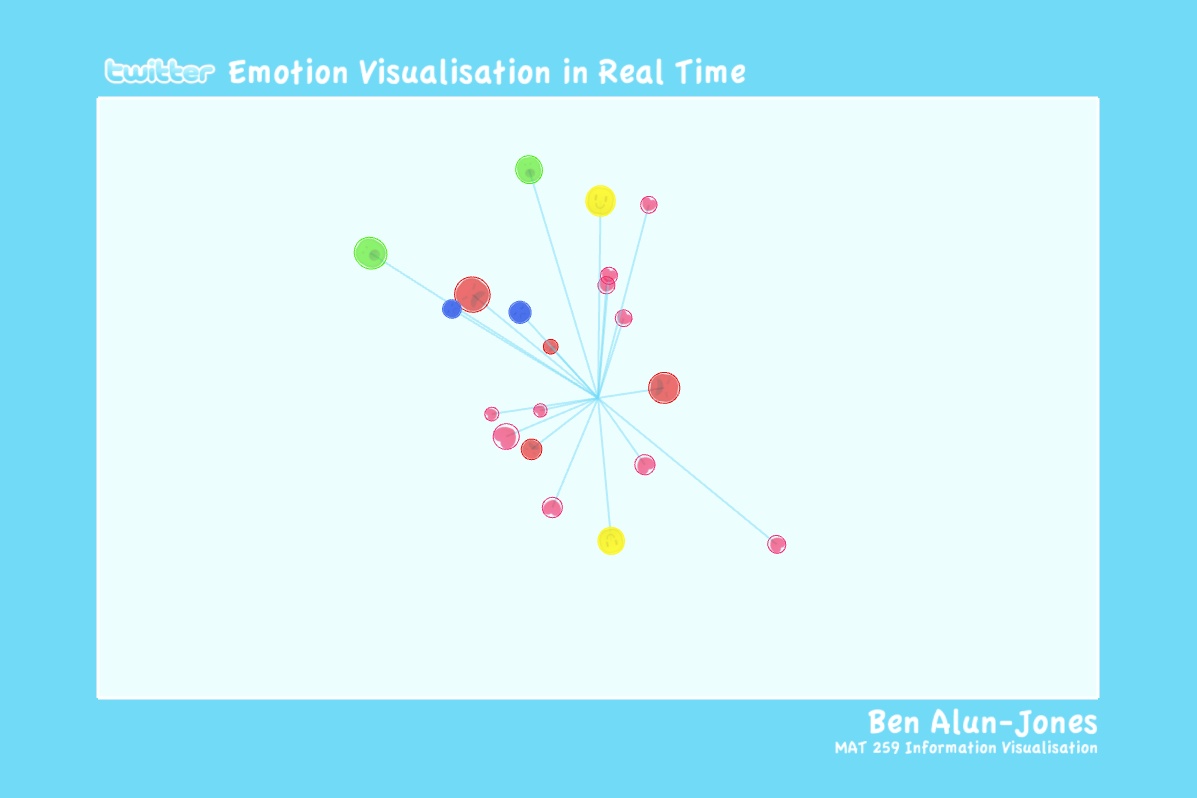
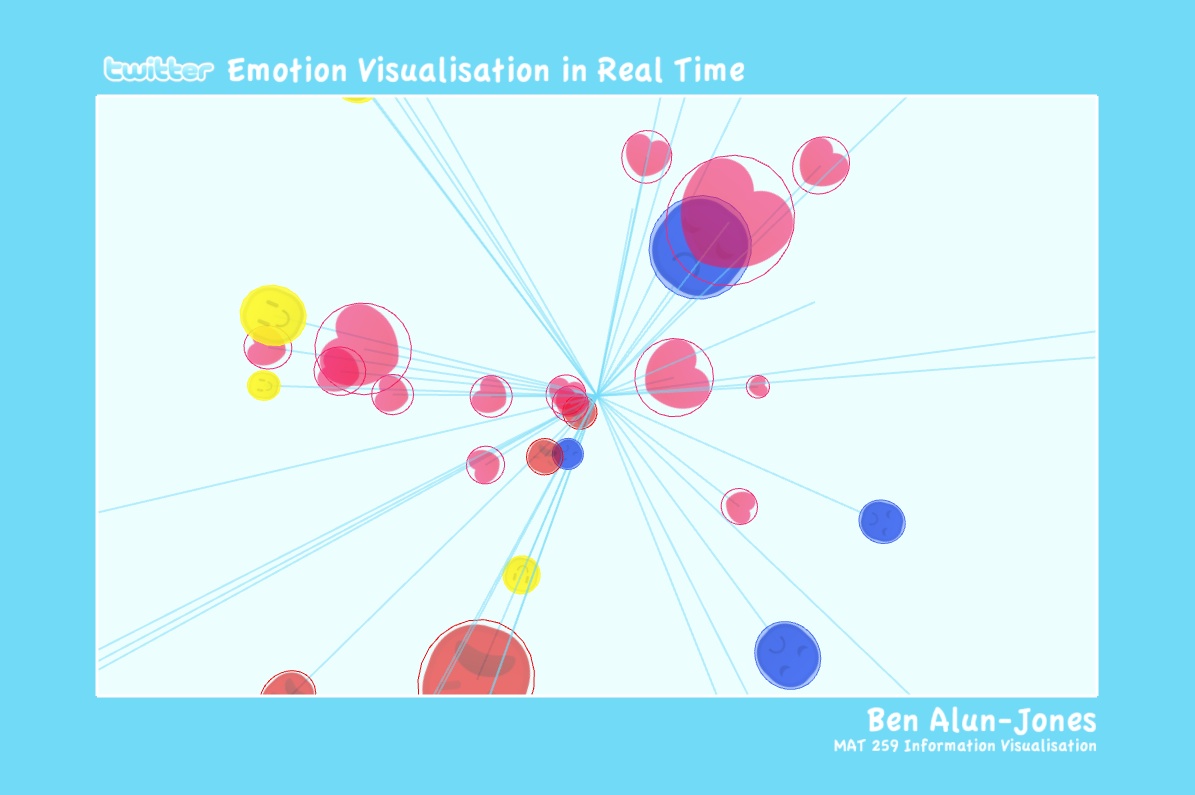
How the applet works:
Tweets are categorised tweets based on whether they contain examples of the 6 'core' emotions and if so, displays them in 3D space. These core emotions are love, anger,surprise, joy, sadness and fear. A tweet is classed as being of that emotion if words describing that emotion occur in the tweet. By default the visualisation grows with time and will rotate freely in 3D space. The size of each emotion shows how many friends the user has, the distance from the centre of the sphere is based on a measure of how involved in twitter the user is. This is based on how many updates the user has posted. The placement around the sphere is based on how many followers each user has and their userID (a measure of when they joined).
N.B. A working internet connection is required to run the visualisation
Applet
If this fails to load, then download the full applications for your system here: Mac OS X / Windows
Source code - free and available to download: TwitterViz / Emotion / Built with Processing