MAT 259 - 2011W


The Transactions Treemap

Sandeep Bhat | Project 2 | 2D Spatial Treemap


Description

Similar to my first project, this project too tries to study the relationship between the number of transactions in a given year, the dewey numbers and the first letter of the item titles. In my first project, the user was presented with a large matrix of colored cells (DewLets) that illustrated this relationship adopting a show-it-all-at-once visualization approach. However, in this project I have used a show-as-required approach to visualization and presented the same data in a more streamlined fashion using treemaps. 

The project was realized using Processing. The code development and debugging were accomplised using Eclipse IDE. Ben Fry's treemap library and example code provides the basic framework for treemap. The visualization is based on the data got from the spl_all database hosted on tango.mat.ucsb.edu. This database contains information about all the transactions in the Seattle Public Library done between 2005 and 2010. For this project only the deweyClass and title fields are being considered.

Quick Links

Applet | Source Code | First ScreenMoving to lower levels | The Address Bar | Moving to higher levels | DataSet Selection


Initial Doodle Initial doodle of the visualization

First Screen

The Transactions Treemap applet has a 4-level recursive structure with the following levels: Year, 100s Dewey, 10s Dewey, First Letter of Titles. At each level, the number of transactions for every category of that level is indicated by the areas of the rectangles in the treemap. The color of each rectangle indicates the order of the categories. The colors are spaced out evenly on the HSB circle, based on the total number of categories at each level.

By default the information shown considers all available titles in the SPL database. While finding the first letter of titles, common words like the, in, a, an, of are ignored.

The following images show the initial screen of the applet. Hovering the mouse pointer over a rectangle gives information about that category. The second image below shows the cursor hovering over 2008. Notice the change in brightness for that cell from the first image. The long name for that level/category is shown at the bottom left, the total transactions for that category is shown in the bottom right. The percentage shown indicates the fraction of treemap area occoupied by a rectangle. This aids the user in gauging how a particular category fairs in relation to other categories at this level of the treemap.

Default Layout


Moving to the lower levels:

When the user left-clicks on a cell, the contents of that cell are revealed, while the contents of the remaining cells in the treemap remain hidden. As before, hovering over a cell gives information about that cell. Left-cliking again on a revealed cell zooms-in to that level and the categories from the top level are replaced by that from the lower level. The new cells all have the same Hue as that of the base level but with randomly varying brightness . Left-cliking on any of the cells would now reveal its hidden contents (if any) and also change its color.

The following image shows the effect of left-clicking on 2010 cell. The contents have been revealed. A dark band at the top indicates what category these revealed cells belong-to. The information shown below the treemap is for mouse hovering over 700 ART cell.

The following image shows the effect of left clicking again on a previously revealed cell. The new level now zooms-in and fills the entire treemap area. An address bar (more info below) appears at the top of treemap indicating the category to which the current level belongs-to. The information below the treemap now includes the long name for the top-level category.


Address Bar

As the user left-clicks to go deeper and deeper into the treemap, the address bar at the top keeps track of the categories at the higher levels that the user has traversed to get to the current level. For example, in the image below the user is currently in the fourth level (First letters of titles), having traversed year 2010 at first level, 100s Dewey 700 ART at second level and 10s Dewey 780 to 789 at third level. The mouse was hovering over cell when the screen-shot was made. In addition to information about cell B,  the corresponding long names of the higher levels are shown below the treemap area. 

The user can press key 'A' to change the format of the addressbar displayed, as shown in second image below.


Moving to the higher levels

The user can right-click on the treemap to zoom-out to the higher level. Right-clicking on a revealed cell would simply hide its contents.
The following image shows the effect of right-clicking at the fourth level for example shown in section Address Bar. The treemap is now at level 3, with the contents for cell 780 to 789 revealed, the mouse is still hovering over cell B. Right-clicking one more time would hide its contents.


DataSet Selection:


Pressing the D key changes the dataset displayed. The datasets are "all"- "hate" - "love" - "photography" - "all"
  • All - considers all titles
  • Hate - only considers titles containing "hate", "war", "bad", "evil"
  • Love - only considers titles containing "love", "like", "peace", "good"
  • Photography - only considers titles containing "photogrpahy", "camera", "SLR", "digital", "lens"

The current selection is shown in the left hand side of the treemap. Note that when the user changes the dataset, the applet would remember where the user had last stopped viewing the previous treemap, so that when the user comes back to a particular treemap he can continue where he left off. This I think would even assist the user in comparing treemaps at deeper levels, across datasets.

Following images shows the top-level treemap for the Hate dataset with the mouse hovering over 2007 cell.


APPLET

This browser does not have a Java Plug-in.
Get the latest Java Plug-in here.

Applet tested on Mac OS X with Safari and Firefox. For Firefox on Windows, please download the HTML to local computer for running*. Built with Processing

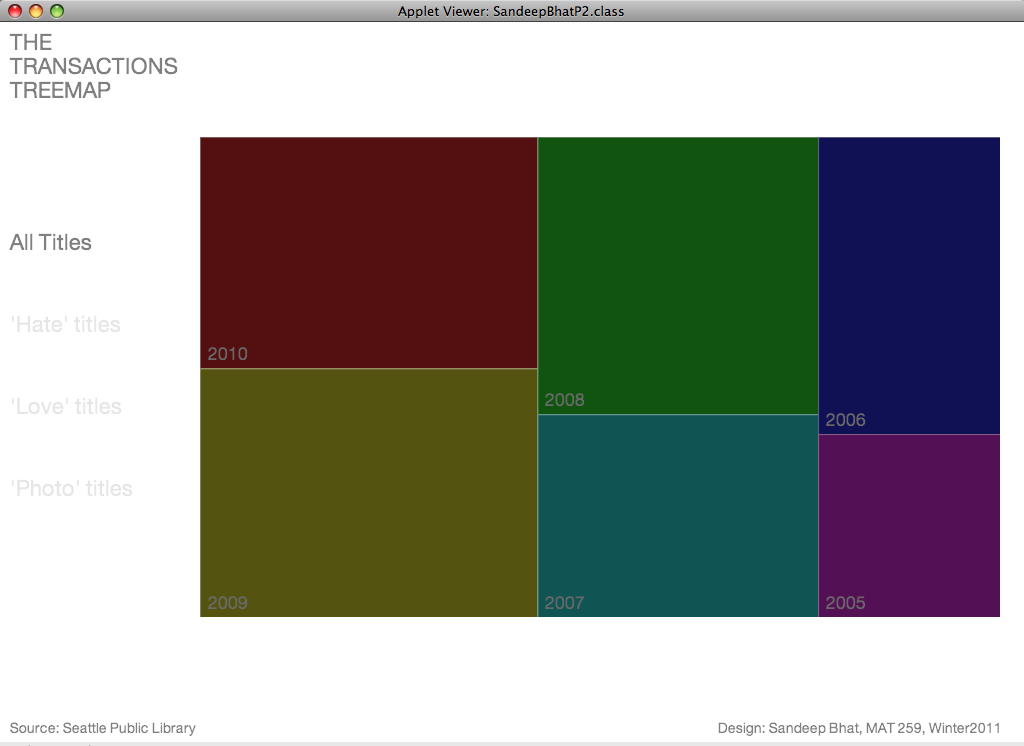
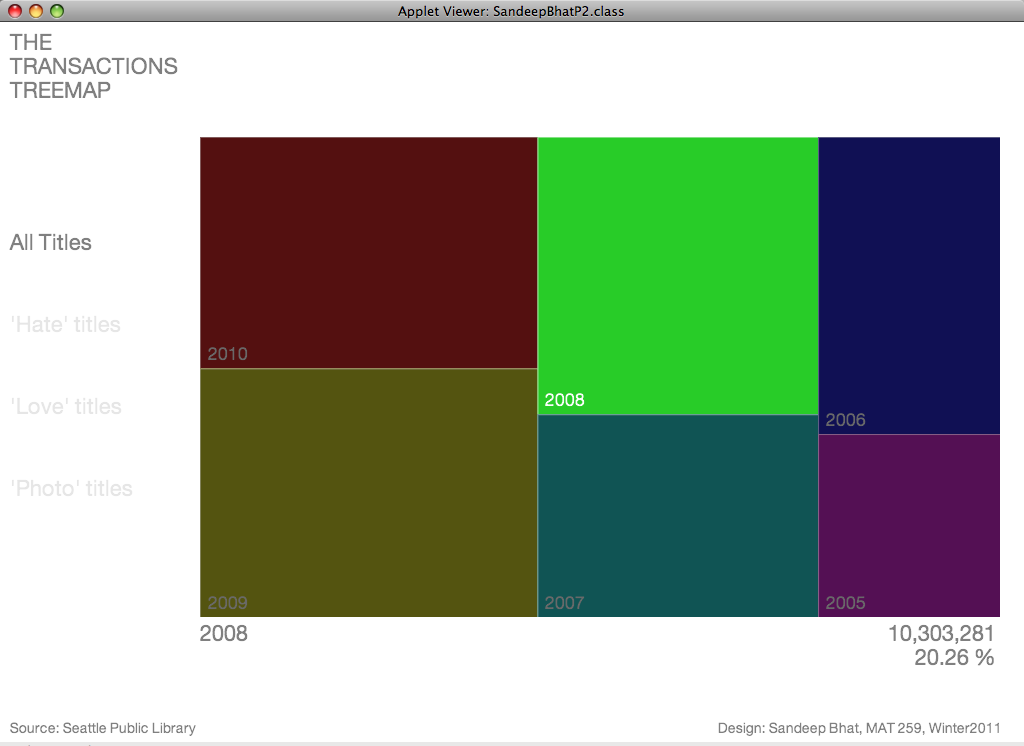
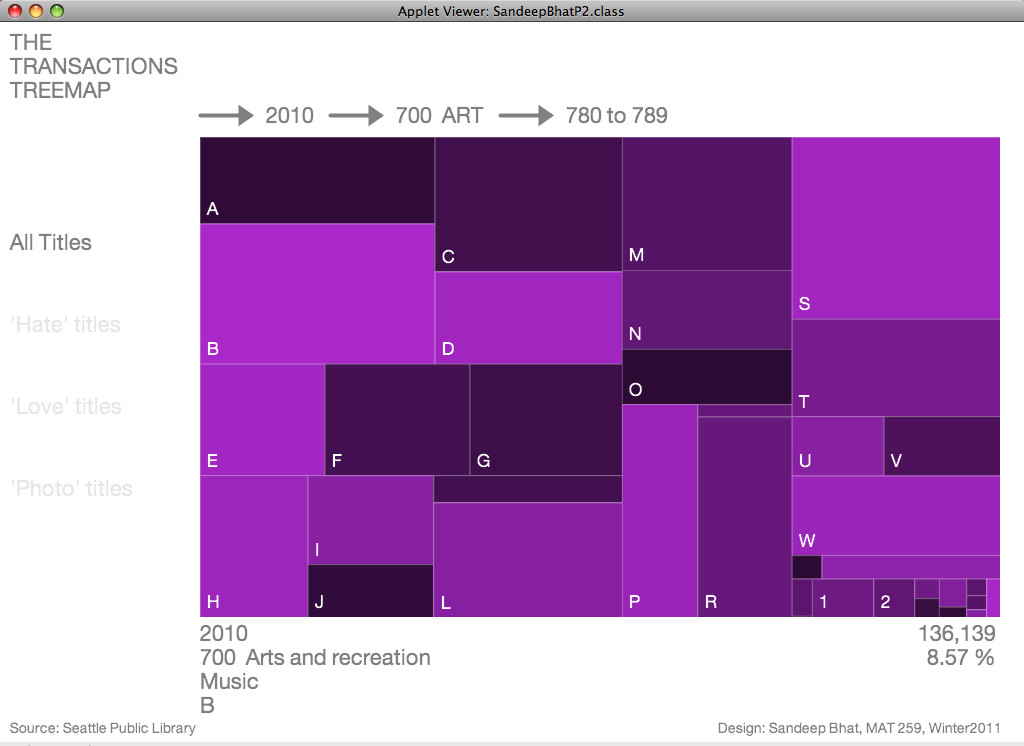
Interacting with your mouse 

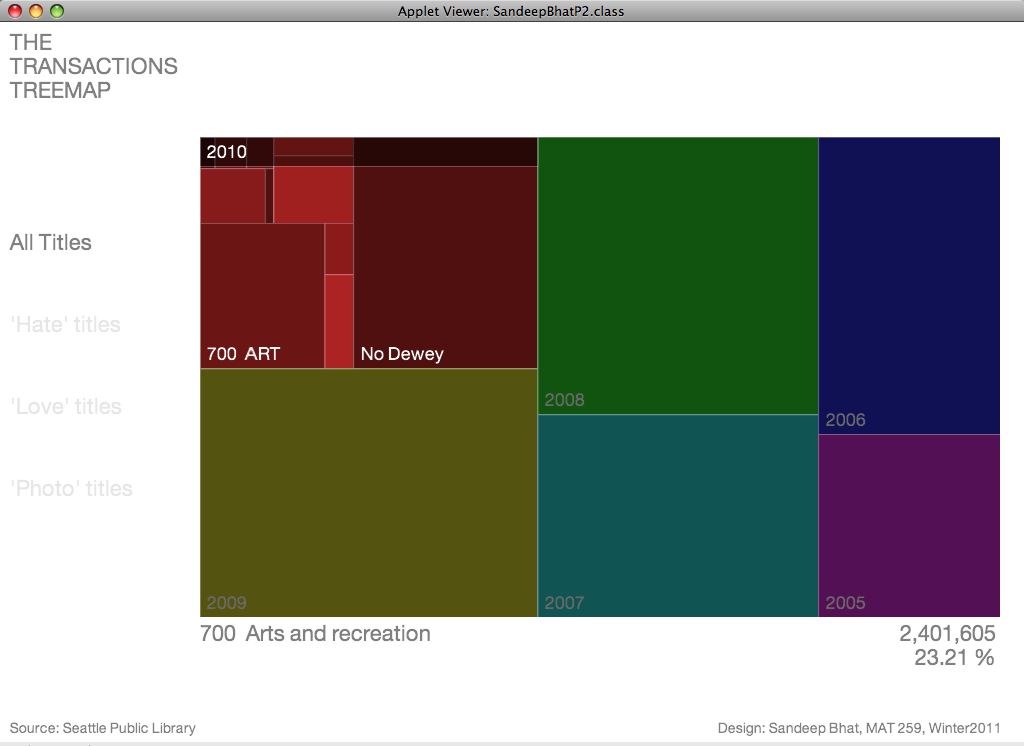
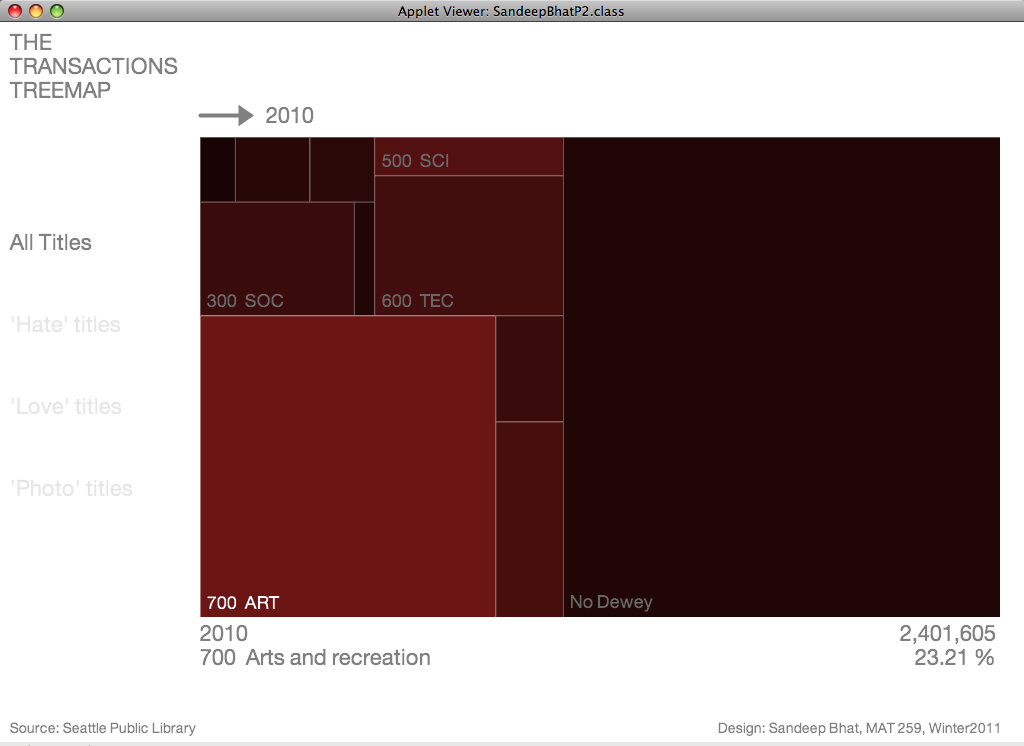
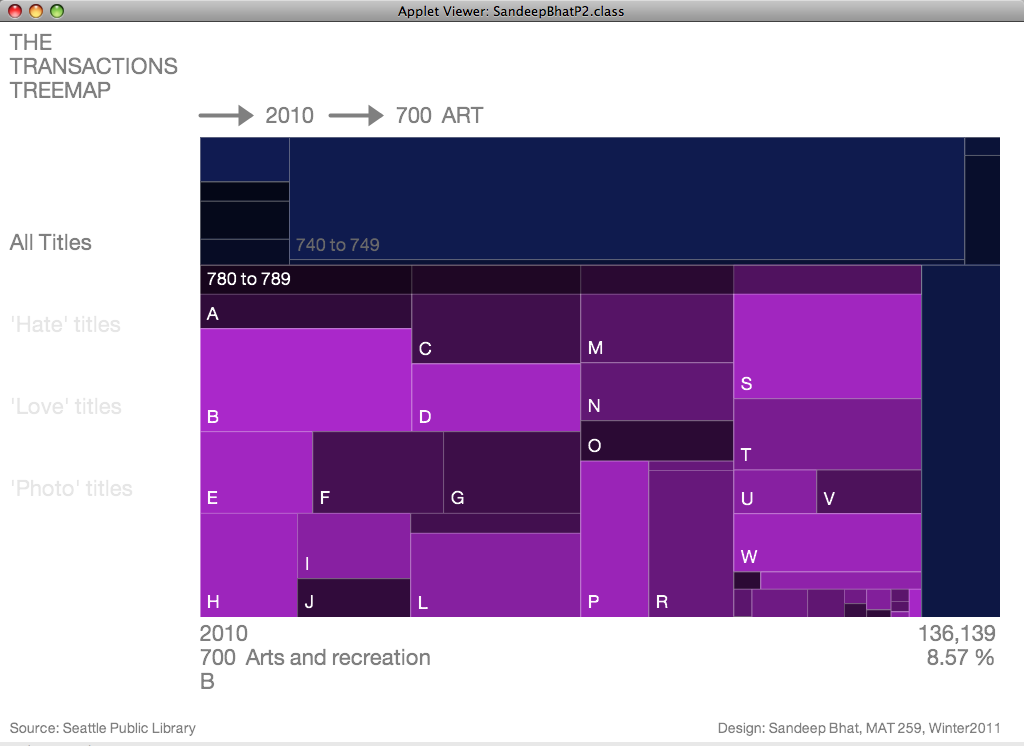
Left-click on any cell to zoom-in

  • The first click shows the contents of that cell
  • The second click maximizes the contents
Right-click to zoom-out from the cell or its contents.
Hover over cells to get information about that cell.


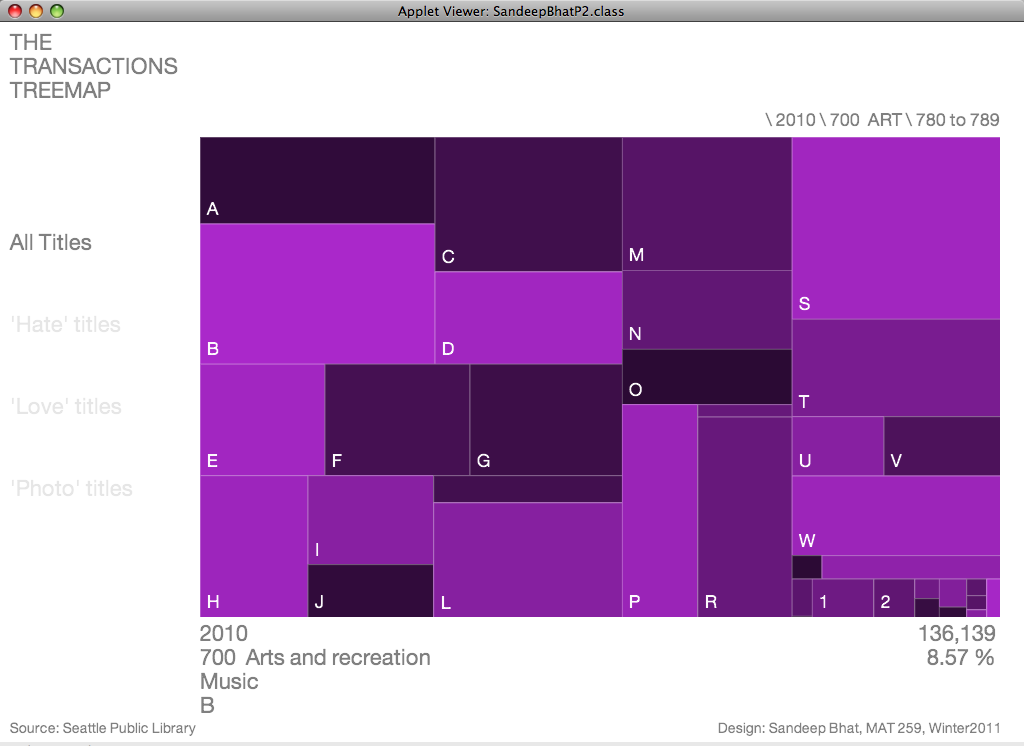
Interacting with your keyboard
  • Press Z to toggle animation during zooming
  • Press A to change format of Address Bar
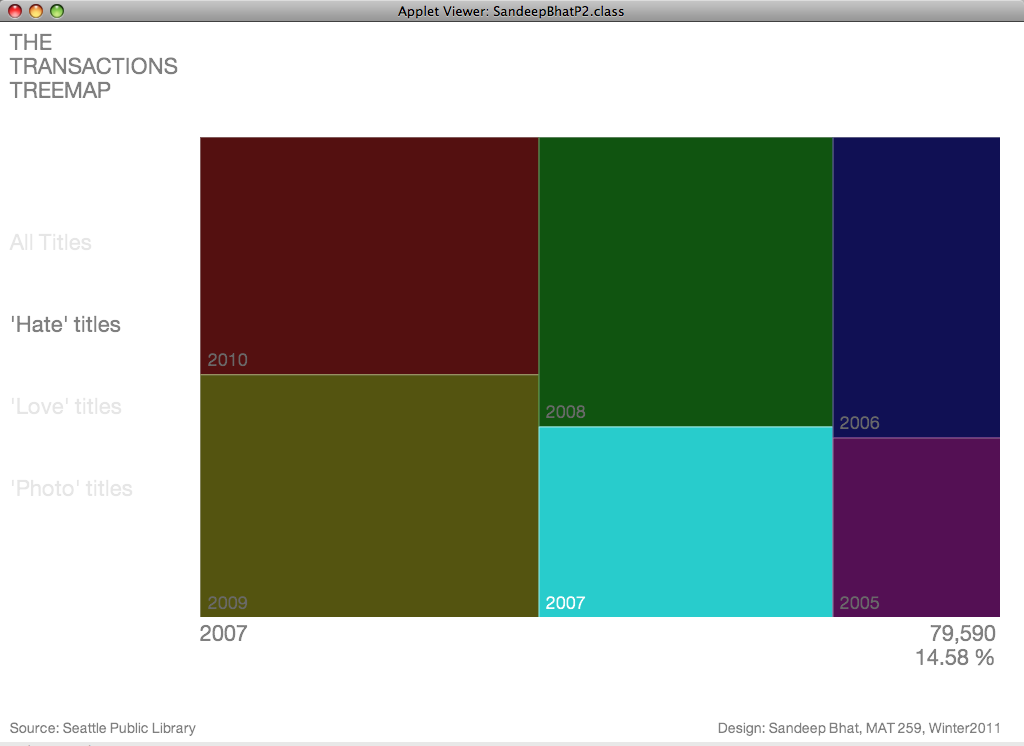
  • Press D to change Datasets ("All" - "Hate" - "Love" - "Photography" - "All")

Source code:

The zip file from the ProcessingSketch link allows you to run the above applet from within Processing.

The zip file from the EclipseProject link allows you to open the project in Eclipse IDE and run the applet.

Both links contain the required code, precomputed datasets and font files necessary to run the applet.

*For Windows, the applet works perfectly fine when it's on the local machine. But when Windows Browsers try to run the applet remotely, an OutOfMemory exception is thrown during loading of fonts. This happens for Processing applets exported from either Mac OS X and Windows XP.