Goal:
For our final class project using Processing, we were supposed to design
something in 3D. Looking for ideas, I began going through the 3D
examples that came with Processing and its documentation. One
example by Ira Greenberg, "CubesWithinCube" (see below), got me thinking about
the spatial organization of data.
CubesWithinCube
(source: CubesWithinCube.pde
Cube.pde)
In the example above, the cubes do not represent any data but
rather are just demonstrating animation. I decided to use a
similar dataset to the one from my second project and try to
represent it in a sort of space like Ira's cube.
Nichole Stockman | MAT259: Visualizing Data | Winter 2011
Project 3: Top X Most Often Checked Out Items from Each Year
Description:
The Process:
I began with one mock-up to get out some ideas. I wanted to show the top X most checked out items from each year (where x is 10, 20, ... 100). But let's just start with the Top 10 from each year. That's a total of about 100 items (less if there is any overlap).
Taking this data, I wanted to represent each item as a sphere
colored according to its Dewey category and grouped near one of the
corners of the large cube.
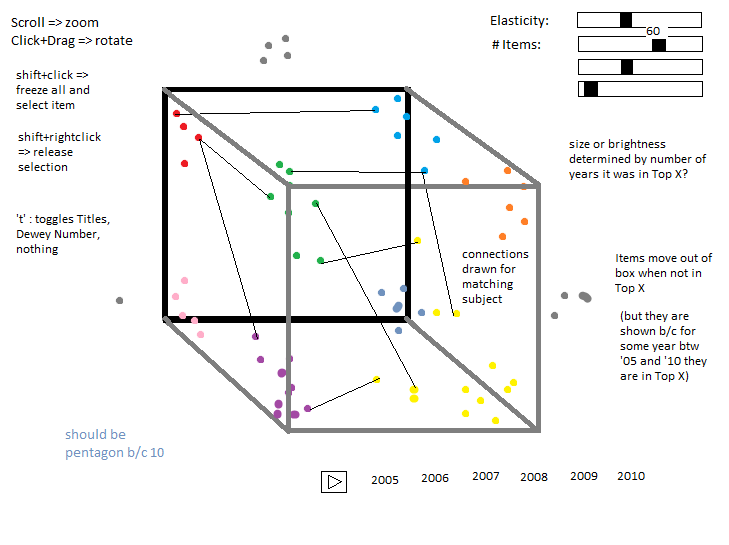
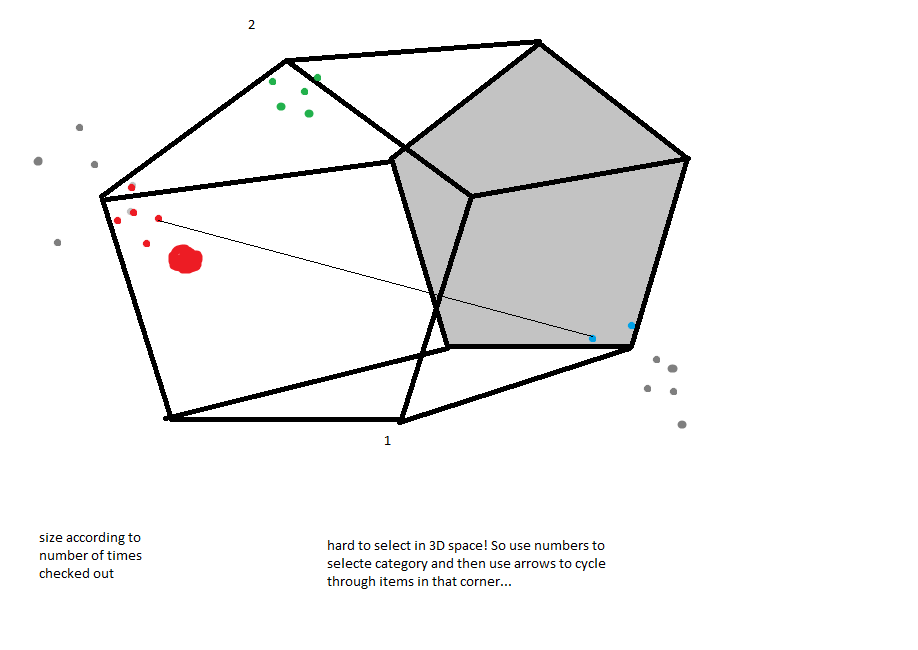
However, the issue arose that there are 10 main Dewey categories and
only 8 corners in a cube. Thus, I ended up designing a different
shape, which I called a "penta-cube" that would have 10 corners.
(I later discovered this shape is actually called a
pentagonal prism).
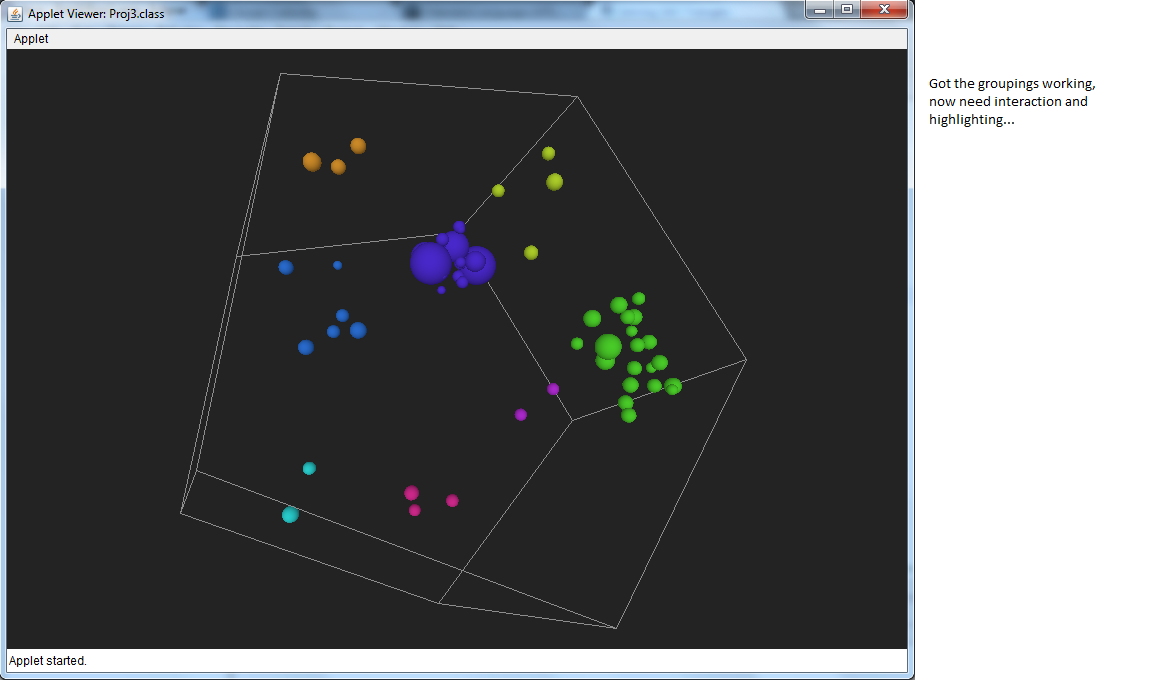
Eventually, I had the shape working and was able to color and group
the items into their appropriate corners:
Next, I needed to focus on interaction. Over the course of the project, this changed a bit from my initial mockups. I am very much a keyboard over mouse type of person, it being perhaps a residual effect of my days of gaming. Instead of having a scroll-bar style of interaction I decided to use the mouse for movement and the keyboard for node/item selection. Actually, after implementing the mouse interaction for movement and rotations, etc. I remembered our discussion of PeasyCam from class and implemented it instead. I'm not perfectly happy with its interface because of the sort of spin velocity it gives to objects when you rotate them, but I do like how it allows you to control rotation in the x, y, AND z directions simply by clicking and dragging.
Interaction:
The final product uses the PeasyCam interactions of clicking and
dragging to rotate the shape.
There are also a few keyboard commands:
The Data and Display:
Our dataset is from the Seattle Public Library. All items checked
in or out since 2005 have been recorded and some items from earlier
years have been added to the database. The data is in xml format but
has been converted to a mySQL database for ease of interaction.
For my project, I queried the database and for each item, I attained
the number of times it was checked out in each year. I stored
results for the top 100 most checked out items from each year in a
text file and this file is parsed according to the user's choice.
(ie by pressing numbers 0 through 9 to show the top X*10 items from
each year)
The text that pops up on each corner of the pentagonal prism as the
user presses A or D is the title of the Dewey category associated
with that corner. The number preceding the name is that Dewey
category's number (0 through 9).
The text that pops up next to each selected node (as the user
presses W or S) is the name of that item, the number of times it was
checked out between 2005 and 2010, and the first subject listed in
its library description. Titles are appended with [CD] or [DVD] if
the item is not a book.
Visualization:
Source Code:
Program Files:
Peasy.pde (main file) Node.pde (main file) Item.pde
PentaCube.pde
Data File:
Top100FromEachYear-byCountDewey.csv
Peasy.pde (main file) Node.pde (main file) Item.pde
PentaCube.pde
Data File:
Top100FromEachYear-byCountDewey.csv