2016Fall
Ambika Yadav
MAT594GL Task Analysis Design
Visualising Tasks System
1. Each task is represented as a n-sided polygon positioned in 2D space, the x coordinate representing the expected duration and start date of the task and the y coordinate representing the workload (0-1) of the task .
2. Every vertex of this polygon is also indicative of the output of the task .
3. Every task is recognized by majorly five properties which are described in detail with the sample data. In short, it is the Title, Risk(0-1), Resources ,Workload(0-1) and Duration(days) of the task.
4. The size of the polygon also represents in the relative duration of the task . The longer the task, bigger is the polygon representing the task .
5. The polygon is filled with a shade of blue. The opacity of the blue represents the risk factor of the task and extent of the fill in terms of area represents the current progress of the task .
6. Every task is may have a successor or predecessor. These relationships are represented by white connecting lines between the tasks.
7. Finally the conflict is indicated by the red coloration of the task and a stagnation in the progress of the tasks.
The projects goal was to develop a visualization for Task Analysis where every task is defined by certain parameters ,which were defined by a set of sample data points . The visualization is representative of a system of tasks, represented by strategically placed n-sided polygons and the dependencies represented by connecting white lines . In order to enable the visualizer to closely look into the visualization, required interactions are put into place for the visualization .
The project development cycle was distributed into prototyping the development . The prototyping was a process of brainstorming and coming up with a system to visualize these complex tasks . The development phase was the part wherein the 2D working analog of this prototype was developed for the web .
The final development is done on D3.js to make a working application for the web and the prototyping was done on Adobe Photoshop.
The project development had two major phases : Prototyping and Development .
PROTOTYPING
The first prototype was developed considering the visualization to be a 3D visualization . One of the first sketches made for this prototype is the first sketch in the doodles .This was then later projected on to a photoshop file .
STAGE 1 : TASK DESCRIPTION

A task was represented by a n-faced polyhedron, every face representing a resource. This was a major contribution to the visualization, as it helped the user make conclusions about the complexity by simply comprehending the shape of the task. More spherical the polyhedron, more complex was the task . Also the size of the polyhedron represented the relative duration of the task. Longer the task, bigger the polyhedron. The rightmost point of the polyhedron was the end of the task and the leftmost point of the task was the start of the task .
STAGE 2 : TASK PLACEMENT
Next, every task was presented in a 3D space , the strategic placement of every task in the space.The x- coordinate was the start and end of the task in time, the y-coordinate was thought of to be representing the workload, which was a parameter ranging from 0 to 1. Finally the z axis was the risk, where the risk decreases as per the left hand coordinate system . This helped placing the riskier tasks in front of the less riskier tasks, enabling the user to to spend more resources on the riskier tasks.
STAGE 3 : TASK AND RESOURCE RELATIONSHIPS

The tasks are followed and succeeded by predecessors and successors which form an important part of the system and are represented by interconnection between these task structures. These relationships are considered as resources to a task . Every output of a task which is an input to another task is represented as a face of the polyhedron .This brings us to another important resource, the human resource. These are represented by protruding lines ending with a colored sphere. The sphere representing the department of the human resource.
STAGE 4 : HANDLING CONFLICTS AND PROGRESS

When two resources are being simultaneously used by two tasks, or probably when the input resource to a task, is not ready as the predecessor task has not been finished, a conflict arises. In such cases the face of the polyhedron representing the conflict associated resource is highlighted. Also the progress of every task at the current time is represented by the volumetric filling of the polyhedrons.
STAGE 5: INTERACTIONS
Finally the prototype interactions had to be put into place. The complete visualization was in a 3D space, which could be have different views controlled by the mouse, giving a peasy cam kind of an effect. The cycle of every task, its predecessors and successors along with the interconnection are highlighted for clear viewing when any task is selected .
DEVELOPMENT
The next step was to make a working 2D model of the prototype developed on a web based platform . This was done with the help of the data visualization library in Javascript, D3.js .
STAGE 1 : DATA GENERATION
The first part was creating the working model, was to develop fake dataset and deciding what parameters would be required to describe each dataset . As the project was being developed on javascript, the data is more is converted from a cvs and stored into a json format file, using the parser written for this application .
Each data point looks like :

Workload and Risk are parameters ranging from 0 -1 respectively . The expected duration is the pre calculated time expectation for the task given that all the resources required by the task are available at the beginning of the task . The Task_Name is the title of the task used to identify the task . The Start_Date is the timestamp of when the task begins . Resources is a list of the resources required by the task for its completion . Every resource has two components, an alphabet and a number . The alphabet representing the type of resource and the number indexing the resource. H stands for Human resource and the number represents the which resource are we listing here. O represents output resource . These are resources which are an output of another task, which is the number on the “O” resource. R are general logistical resources required for the task and the number indexes these resources. Task_Description is an unused data parameter, which at any point can be used to describe the task .
STAGE 2: CONVERTING 3D TO 2D VISUALISATION
The next part was to make the analog of the 3D prototype in 2D, to create the visualization on D3, which helps in efficient data binding .
1. Task Shape : The task is now represented by a n-sided polygon, every side representing a resource . The polygon derived from a circle geometry divided to make n-sides. The polygon is drawn such that the radius is half of the expected duration ,so that the complete vertical length of the polygon is expected duration of the task . The human resources are handled in a special manner ,they are highlighted more by using a straight line protruding out with a colored circle at the end of the line ,the color of the circle representing the human resource index.
2. Task Placement : The task is placed in 2D space , where the x axis is the time and y axis is the workload .
The leftmost point of the circle/polygon is the Start_Date on the x axis and the rightmost point of the circle/polygon is the end_date = start_date + expected_duration .
3. Interconnections : The task interconnections are represented by the lines connecting the resources of the tasks. If the line starts from the vertex of the task, it implies the output of that task ( represented by O ) is being considered and it acts as an input resource for the connecting task . If the line ends at the face of a resource as marked by I that indicates the input resource to that task .
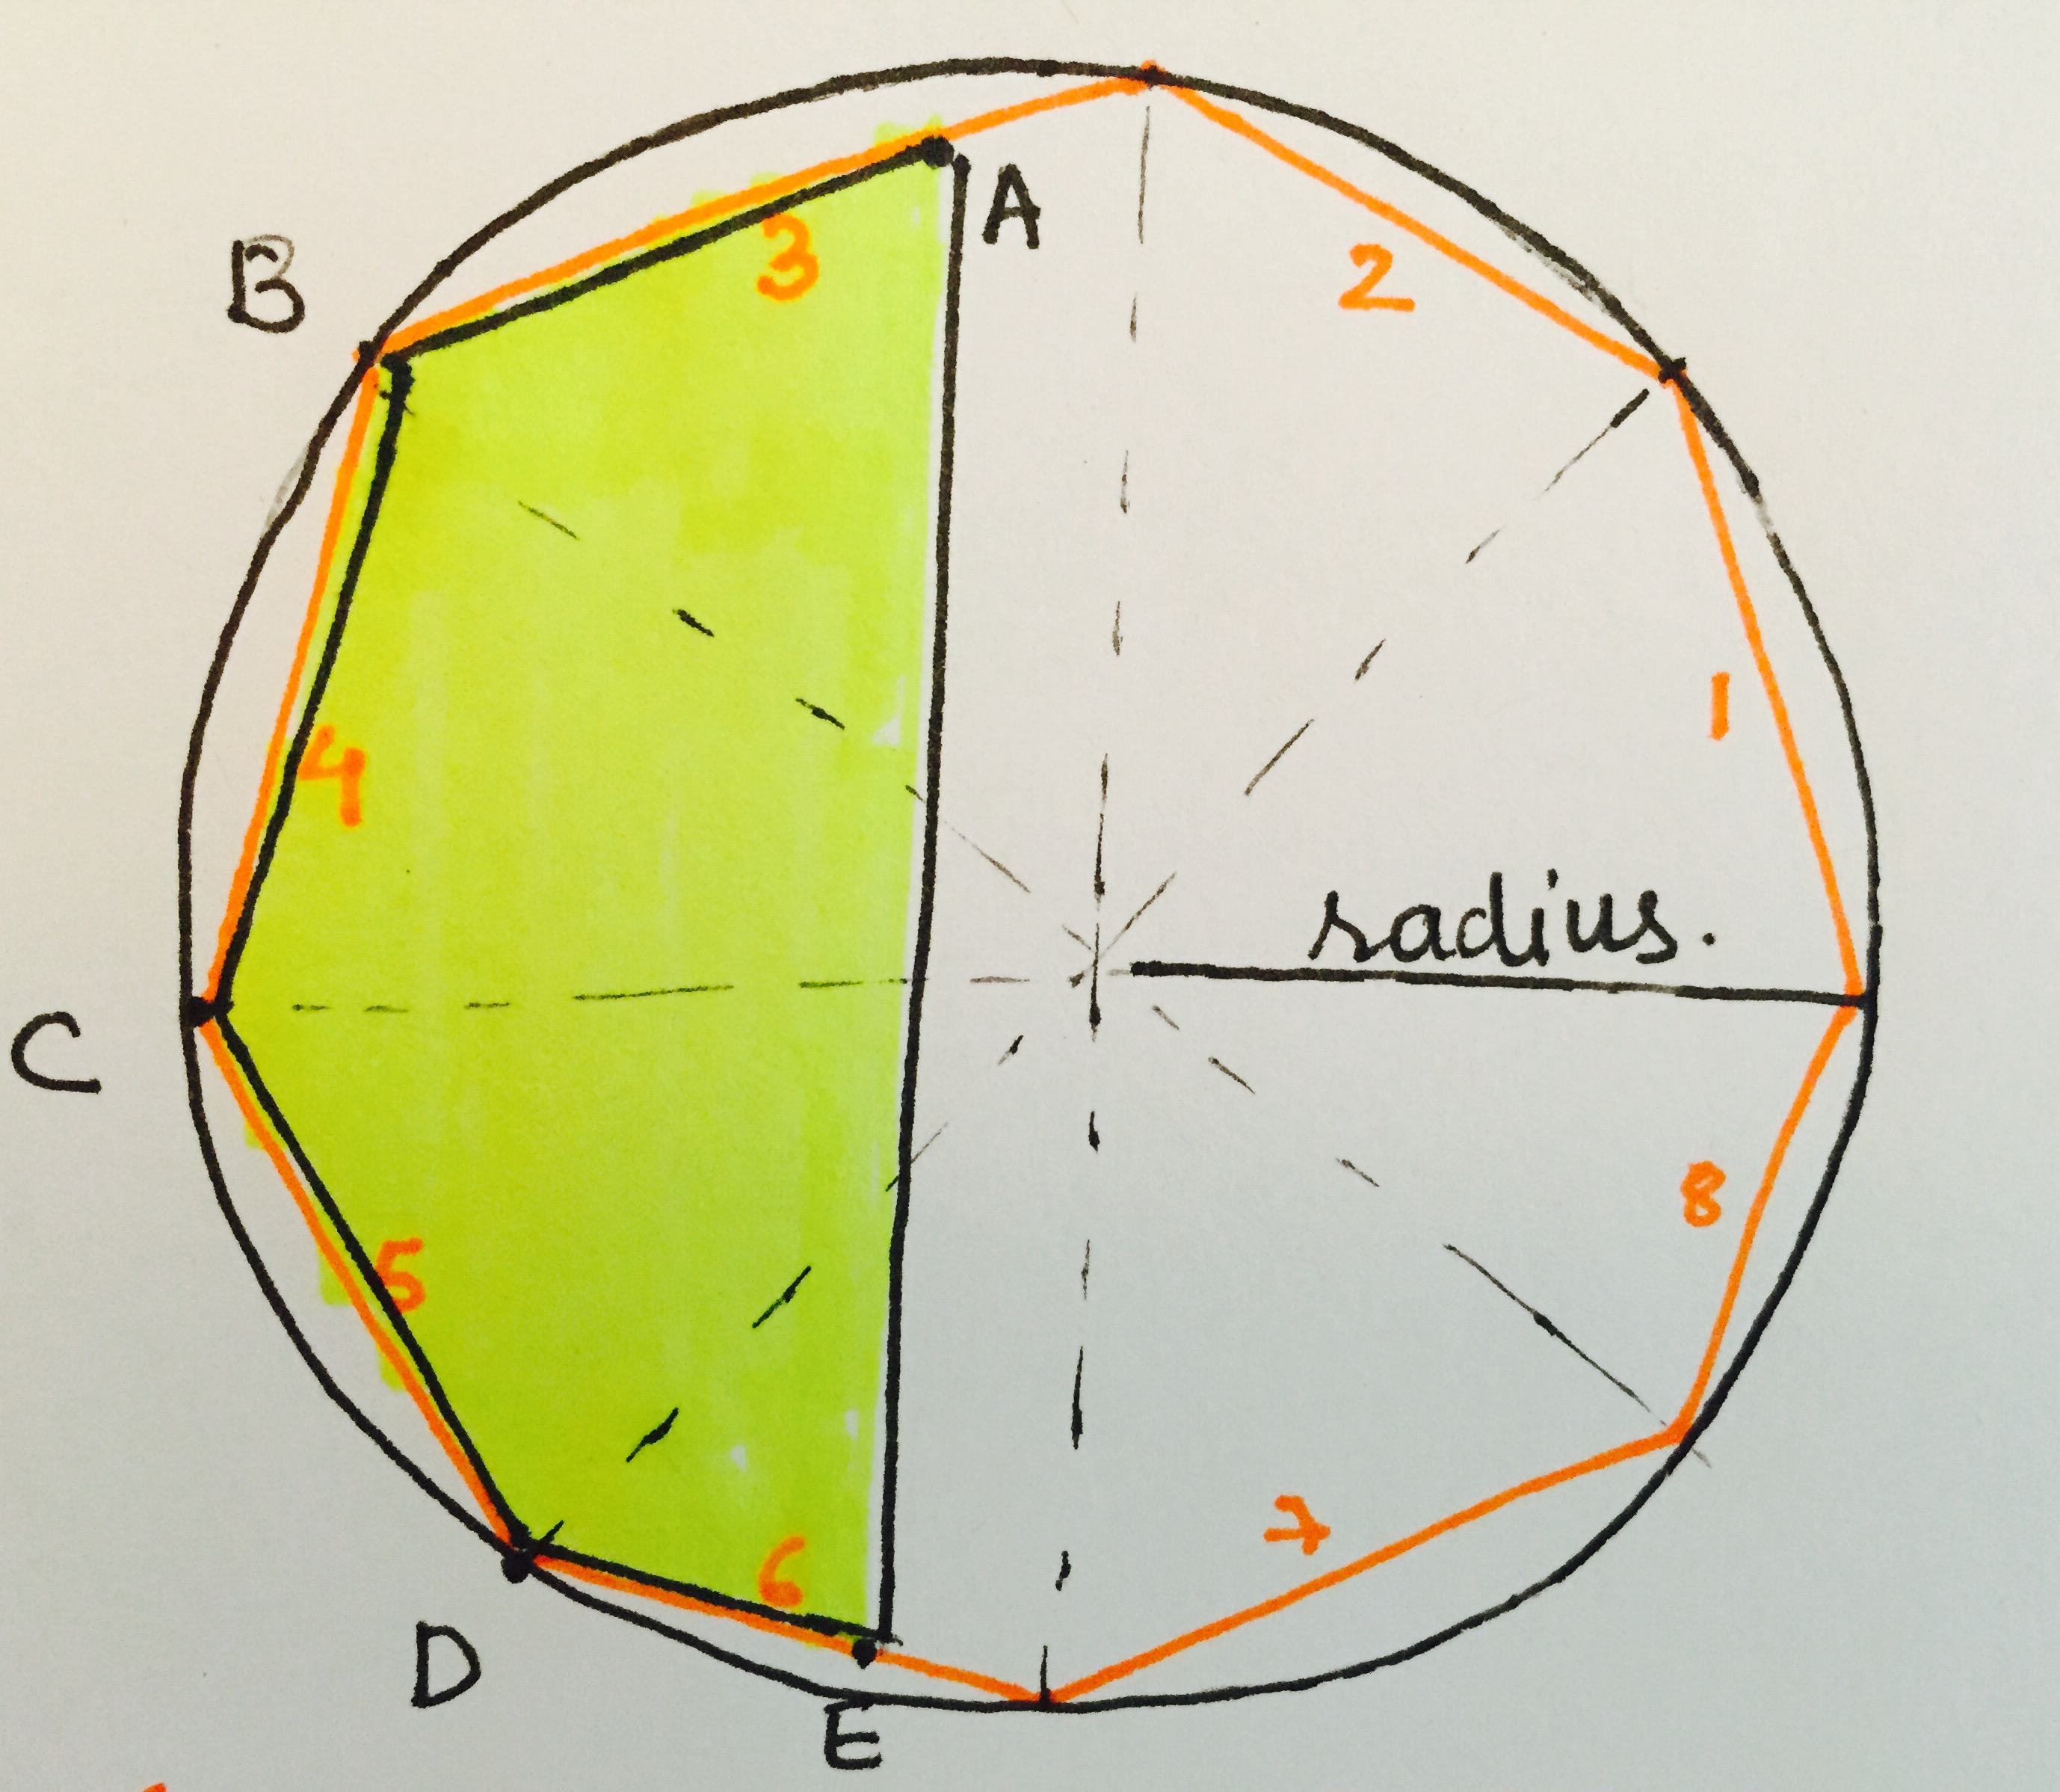
4. Progress and Conflicts : The progress of every task is calculated in real time and is indicated by area filing of the polygon. The figure below is 40% of the task being completed. A new polygon, ABCDE is constructed in real time as per the progress . 40% of the area is identified by finding 40% of the diameter length and extending that in both direction to intersect with the task polygon .
5. Interactions : The user can interact with the system by animating the time . The time starts and stops by the pressing space bar and can forwarding or reversed by using the left and right arrow marks .
First Prototype Sketch

The final visualization is developed as a interactive webpage using HTML,CSS and JS using the data visualization library D3.js ( used majorly for data binding ).The following functions are the important functions used in the visualization :
1.n_faced_polygon( x, y, radius, number_of_points ) : To get coordinates for polygons construction . x is the start_date , y is the workload , radius is the expected duration and number of points are the number of resources.
2.polygon_progress(task_number,progress,x,y,points_for_polygon,number_of_points) : This is to get the coordinates of the progress polygon . The inputs required for this are the task_number ( which data point ) . Progress is calculated in real time and this function is called for the progress polygon construction .x is the start_date , y is the workload, points_for_polygon is the output of the n_faced_polygon , number of points are the number of resources.
3.axis_construction() : To construct the x and y axis and make global x and y scales for the visualization .
4.task_polygon_drawn(id) : Draw the polygons on the canvas given the id of the task .
5.tasks_progress_drawing(refresh_current_date) : Draw the progress polygon in real time given the current time .
6.interconnections_drawn() : Draw the interconnections between the tasks.
7.human_resources_drawing() : Draw the human resource extensions from the task .

The code can be found here .
The photoshop file can be found here .
The interactive web app can be found here .