2016Fall
Intae Hwang
MAT594GL Task Analysis Design
Visualizing task analysis using graphical algorithm eidtor
Each task should be represented as a distinct object or structure.
Many task structures are to be represented in 3D geometrical space.
Each task structure holds five properties (Title, Risk, Resources, Workload, and Duration)
Risk, Workload, and Duration are declared by numerical values.
Each task structure must distinguish the quantity or size of the properties. (e.g. size, shape, color shades, or illumination for different levels of risk and workload).
The relative duration of tasks is to be represented
Tasks structures are connected by an order definition of predecessor, successor, and delay.
Task structure predecessor and successor order definition are to be graphically represented.
Sequential and concurrent task are to be spatially placed to reflect their order.
Resources consist of 0 to many people and parts.
Overuse of the same resources by concurrent tasks is to be identified as a conflict.
The entire 3D visualization must be rotatable for viewing from multiple angles.
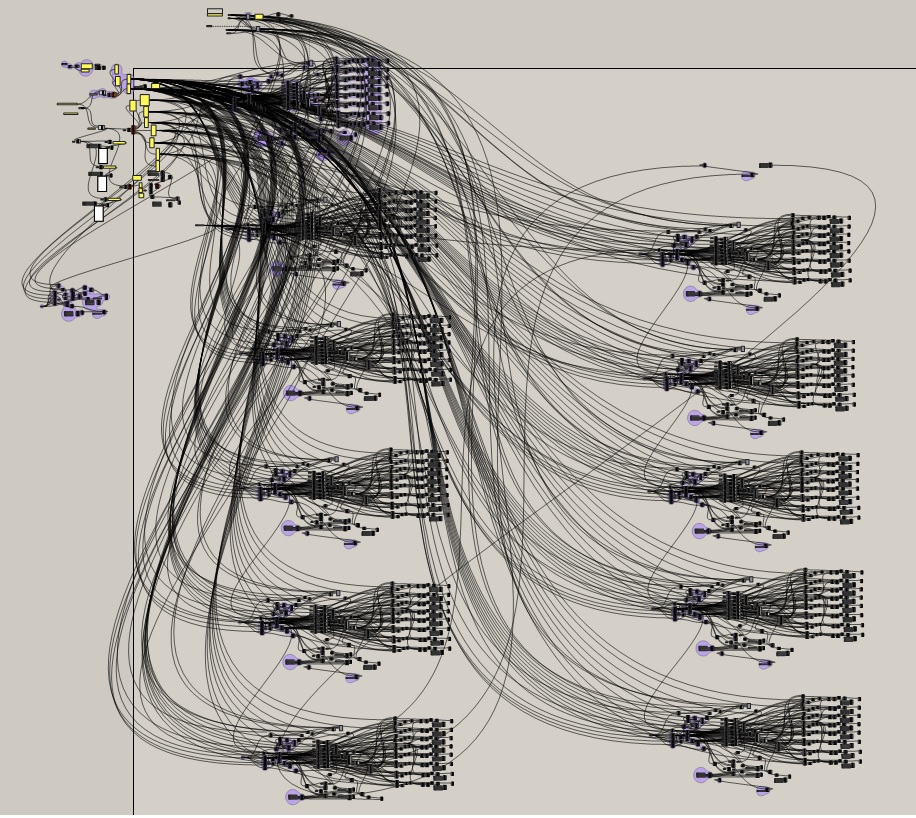
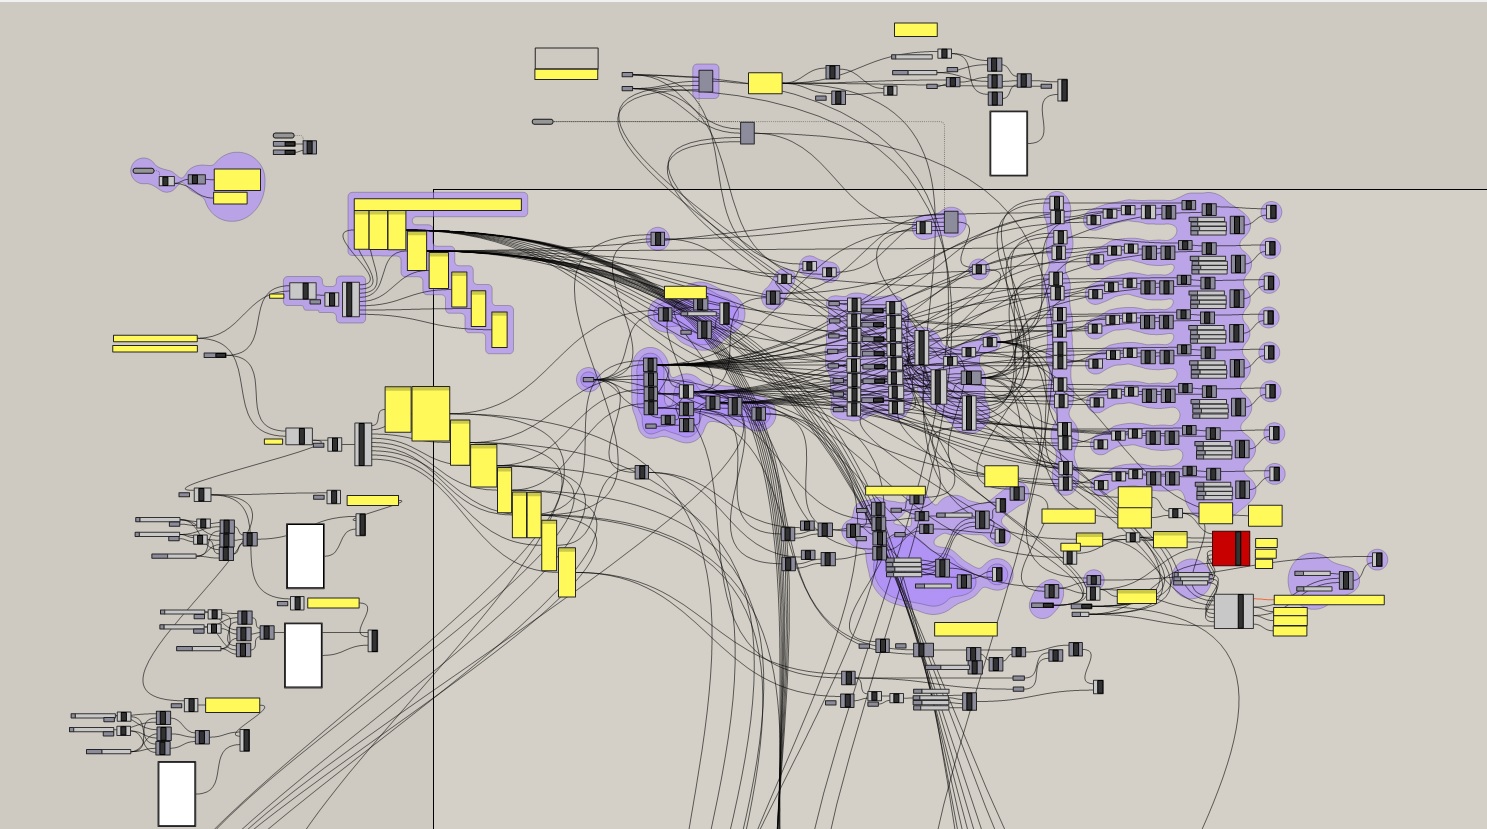
In this project, I tried to figure out better way to visualize a numeric information to a 3 dimentional visual
forms to give better interpretation of information. The main program that I used for this project is "Grasshoper",
a graphical alogrithm editor for Rhino, one of 3D modeling programs. Grasshopper offers a convenient transformation
system between different programs. The original resource was written by Microsoft Excel, which decribes all the task list
,resources, performance, and time. These numeric values are converted to 3D shape which has different colors based on several
graphical algorithm. Most distinctive feature of my project is, a user can see that the progress of tasks are changing by time goes,
the simulation represent all the task progress based on the initial setting, which is distributed by the user's intention.
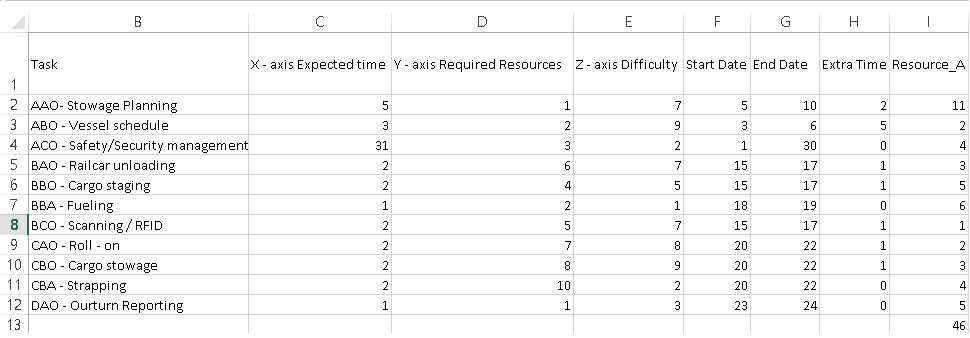
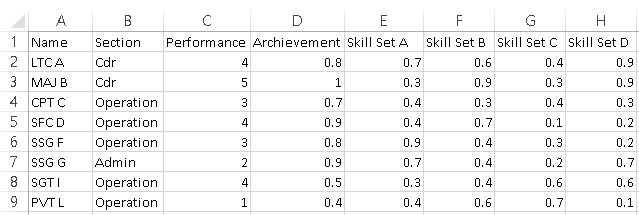
The data for this simulation has two excel sheets.
TASK LIST
HUMAN RESOURCES
All tasks have numeric factors, thes numbers decide size and color of shape in the visual part.
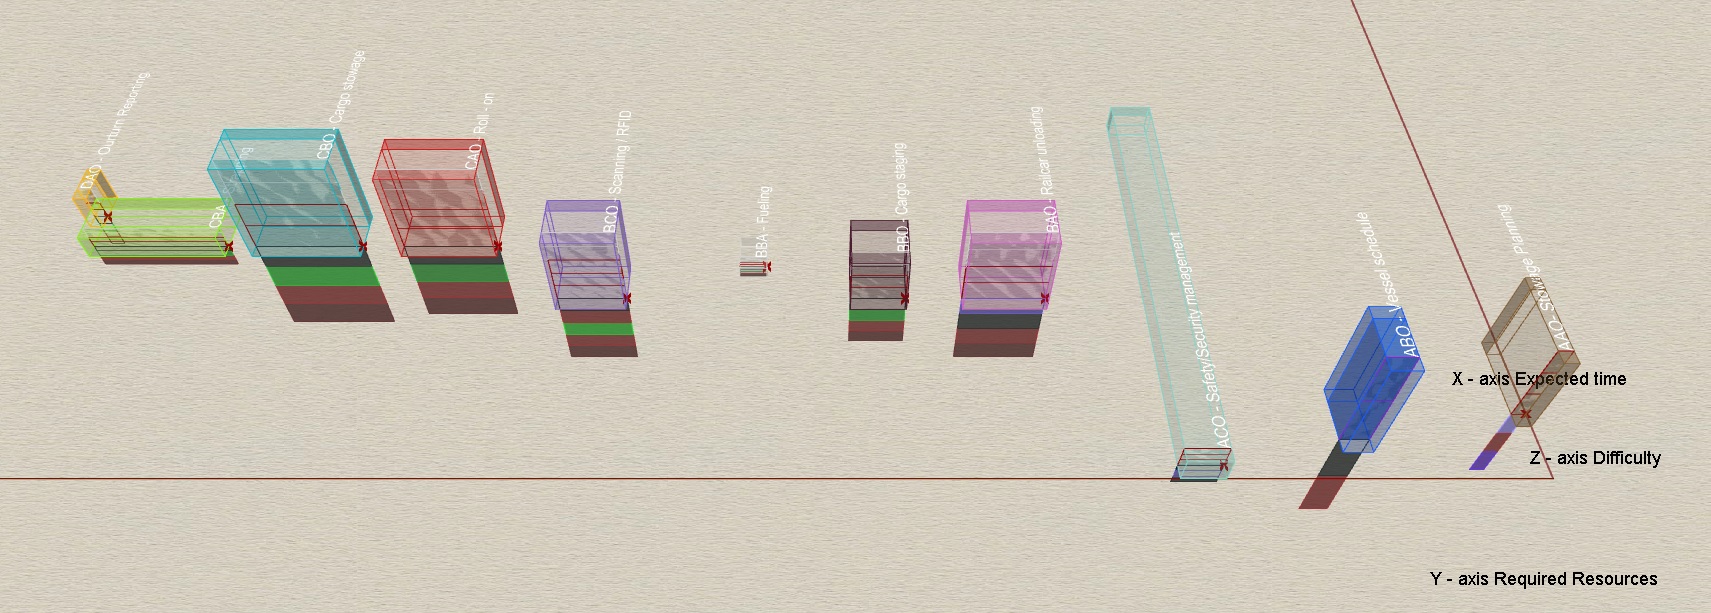
In this picture the width of each boxes (Y-Axis in the program) represent "Required Resources" from the "TASK LIST" file above, the height (x-Axis in the program) stands for expected time,
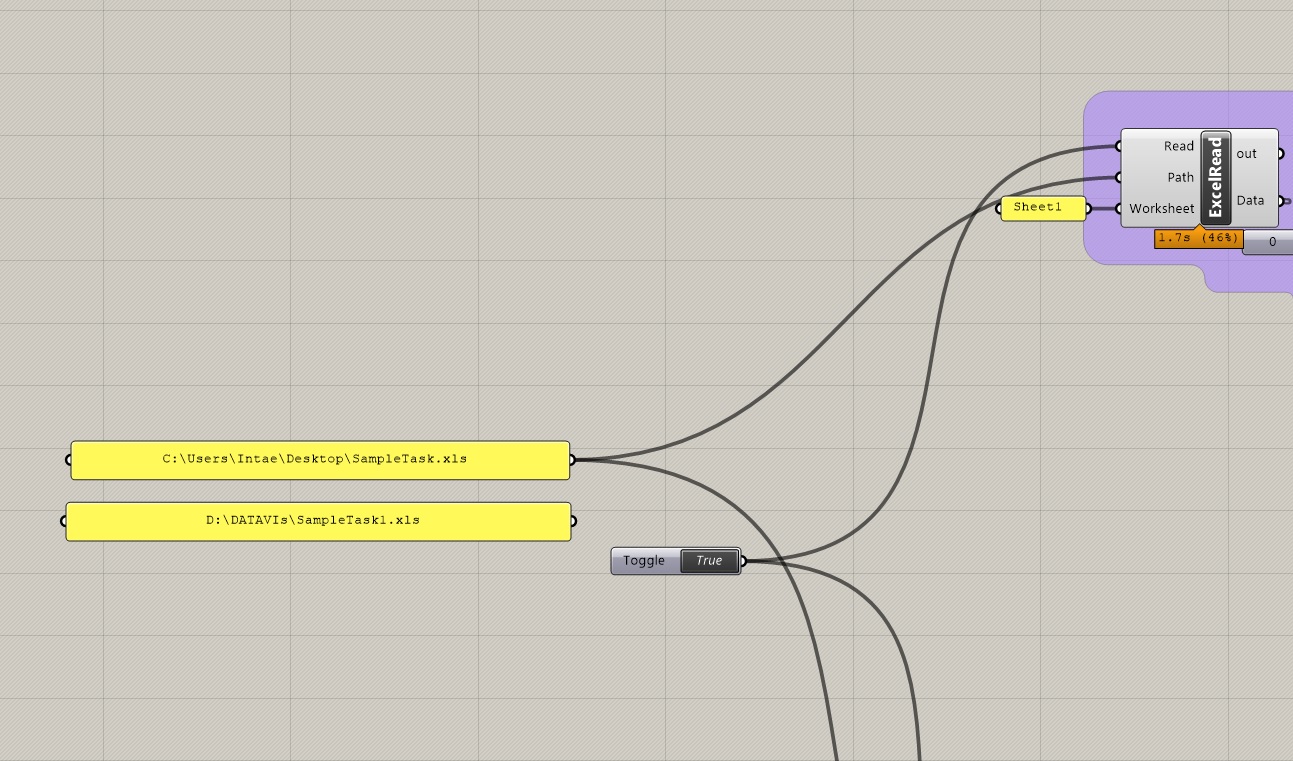
Open and read Excel file
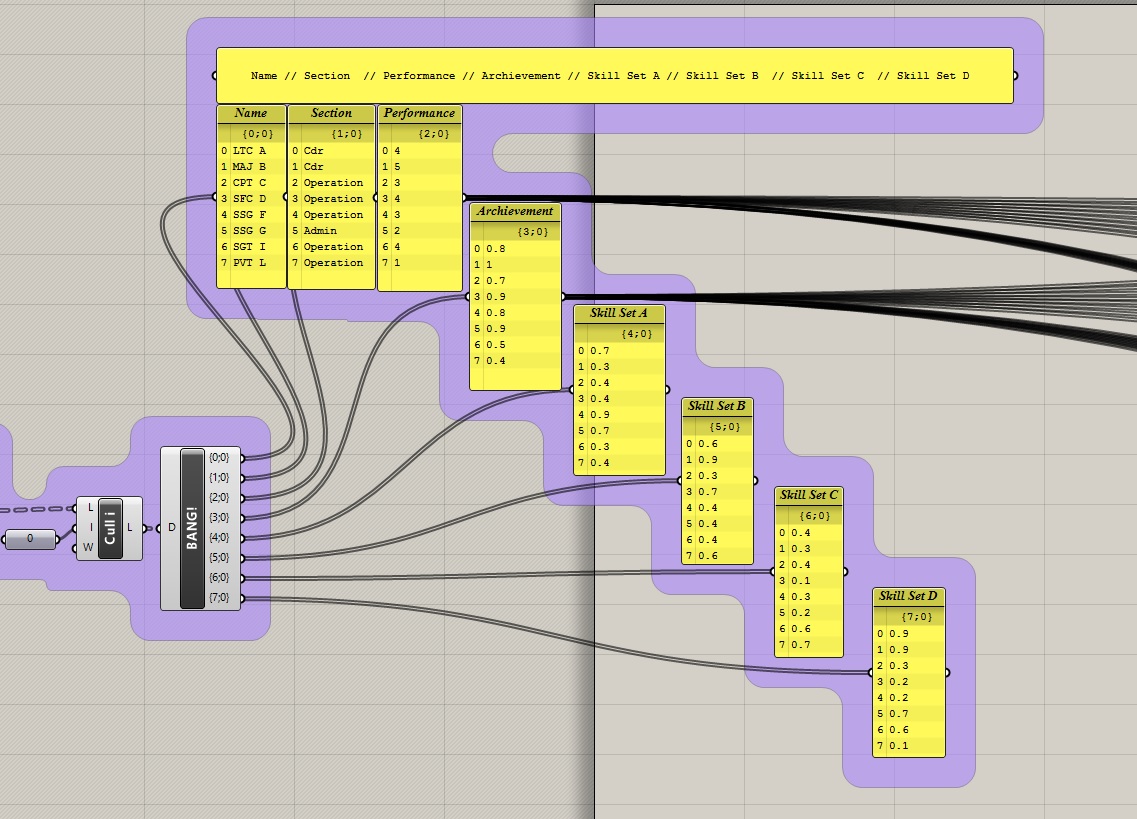
Cull indexed element data and extract all branches(column) from the Excel file [Human Resource]
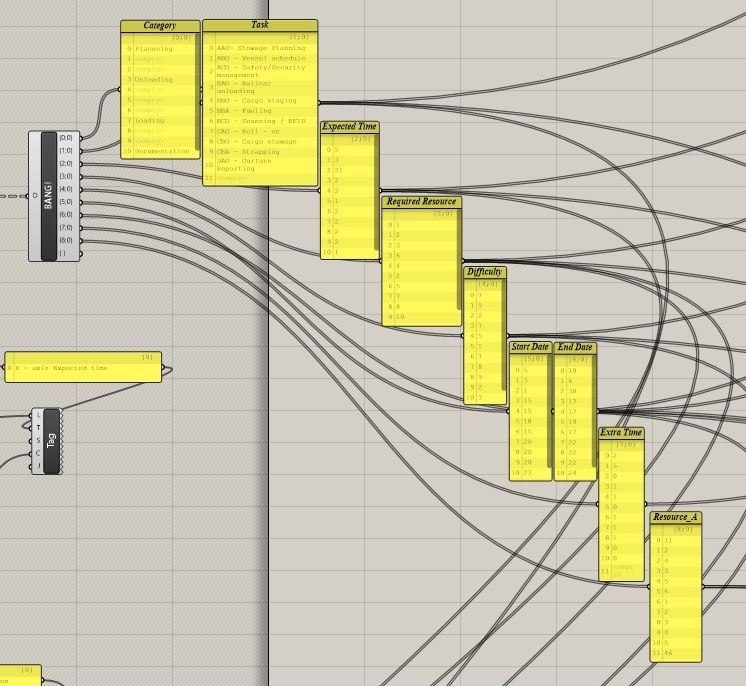
Cull indexed element data and extract all branches(column) from the Excel file [Task list]
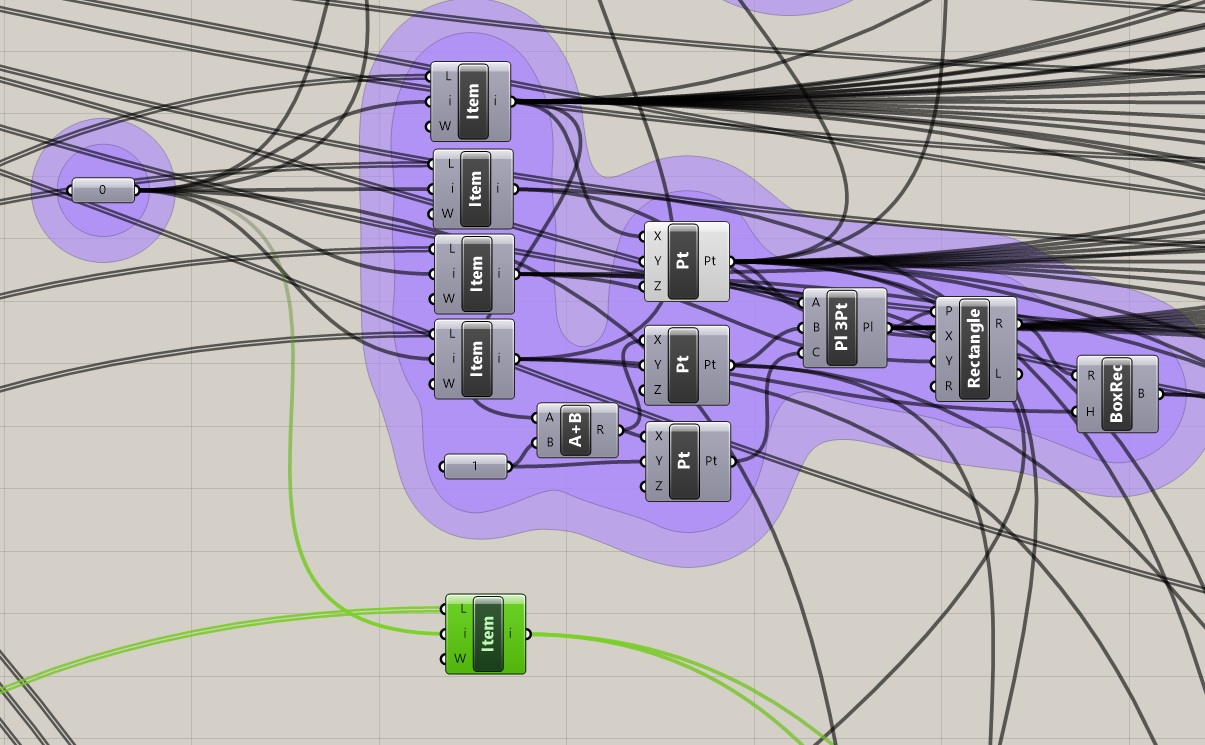
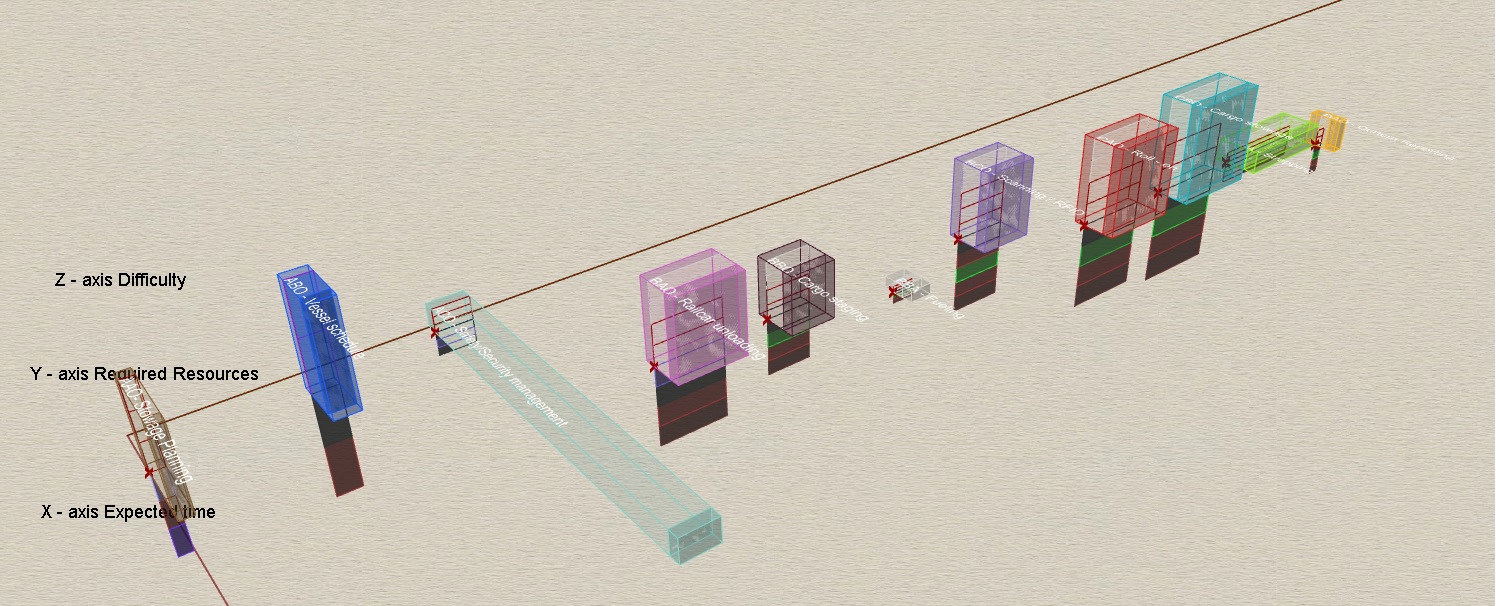
Select the first task. Based on three factors(Expected time/Required resources/Difficulty - numeric value) in each task, a box is created. The location of the cube is its start date.
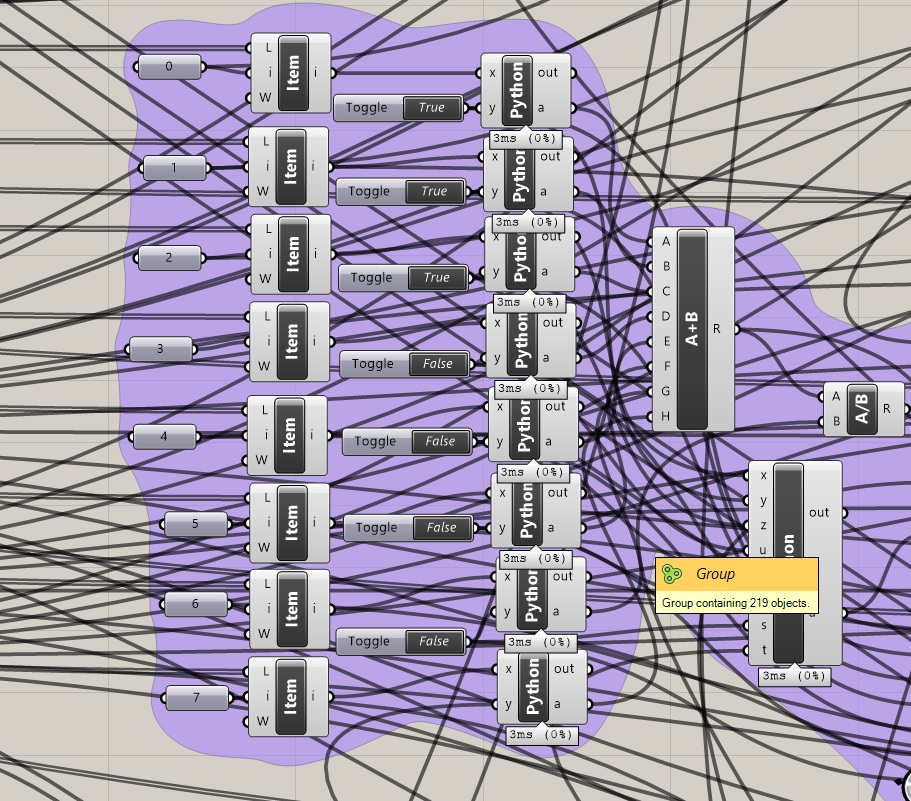
A user can assign human resources by clicking boolean toggles. All the factors of human resources (Perforamce/Archievement) are automatically calculated and applied on the tasks.
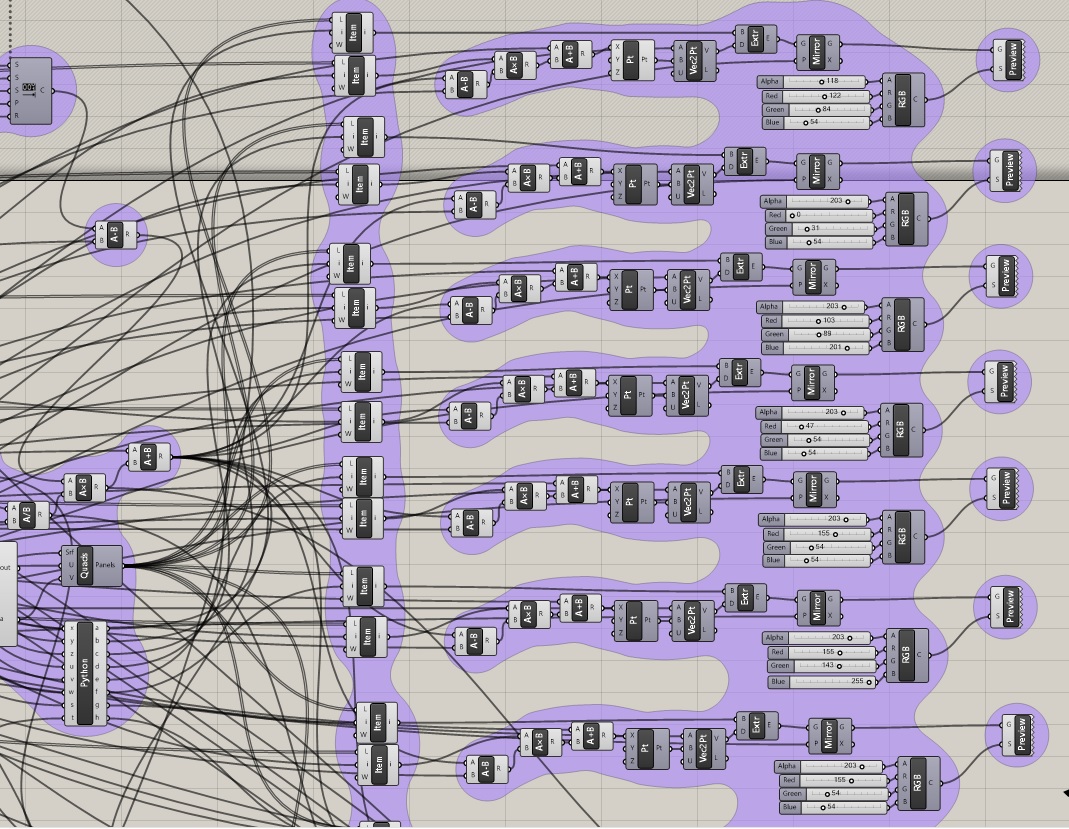
Human resoureces on each task create another set of boxes underneath the task cube, this represents their achievement on the task. All the object can change their colors by adjusting slide bars, the change shows in real time.
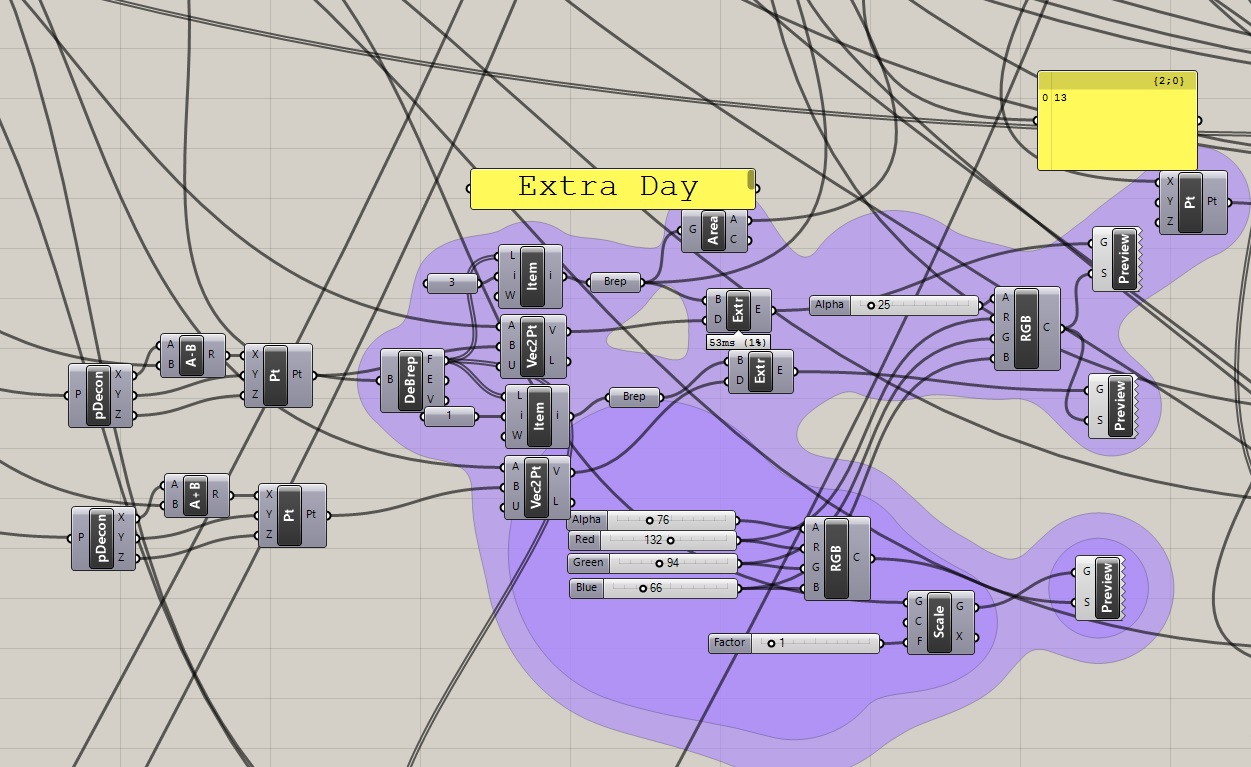
Extra days for each task is represented same way that the cube is.
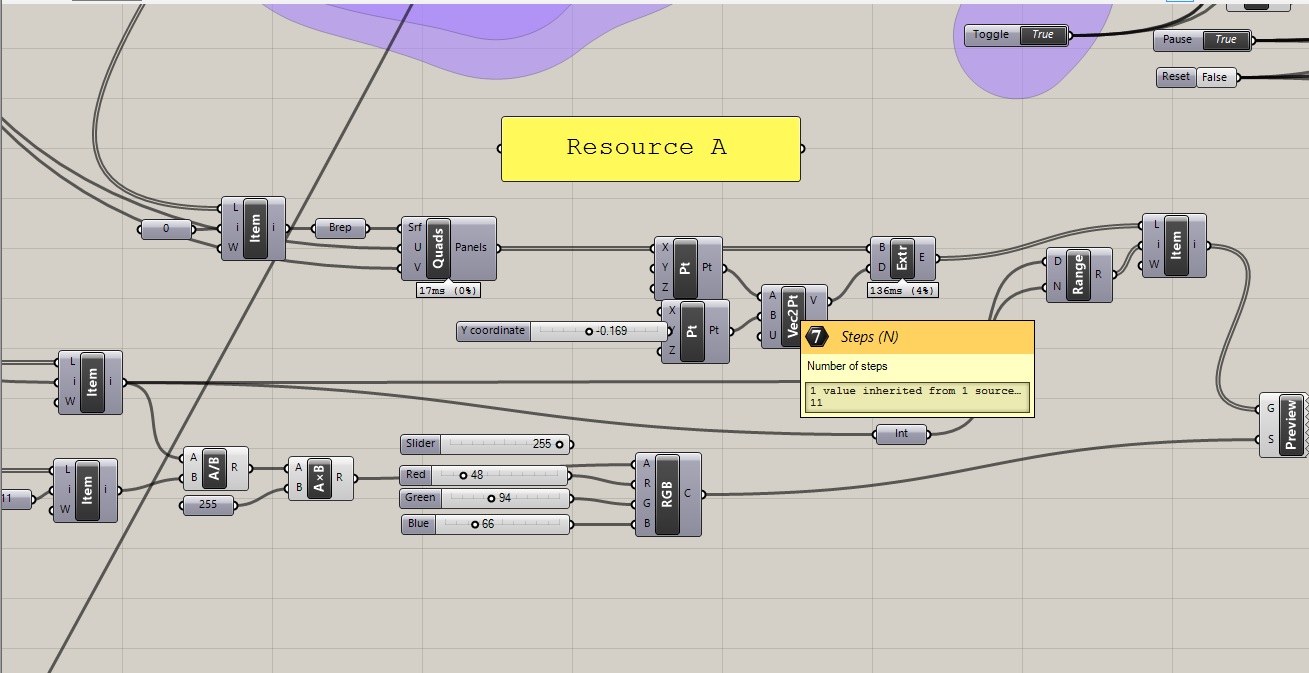
Front surface of task cube is evenly divided and panels on the surface turn specific colors as same number of resource.
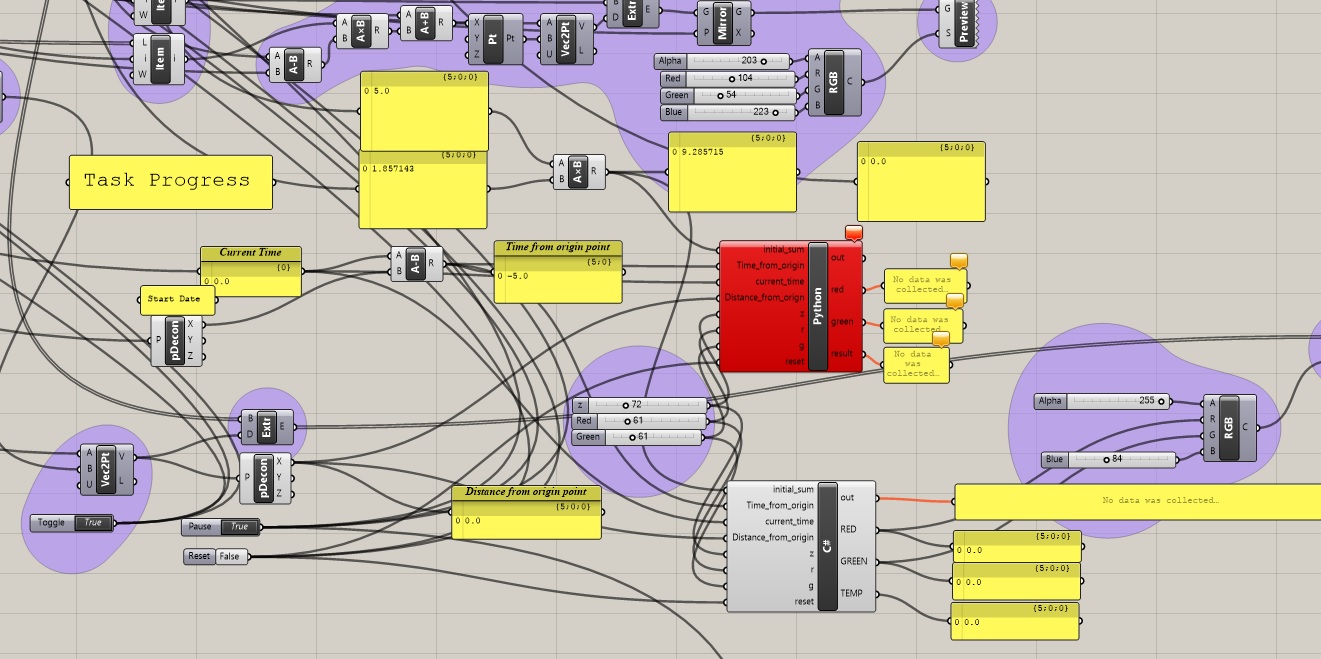
The state progress indicator changes its color compared to the flow of time