2016 Fall
Mert Toka
MAT594GL Task Analysis Design
Polar Tasks
The aim of the project was to develop a data visualization
tool for analyzing multiple tasks in the work environment.
Tasks are defined with five parameters; namely title, temporal values,
riskiness, workload, and multiple resources. Final system should reveal
possible resource conflicts in an obvious way.
The idea behind the design is to use abstract geometries in an expressive and perceivable way. By constructing 2-dimensional shapes and connecting them in 3-dimensional space, the task definition becomes an ever-growing and every-changing abstract figure and conveys its numeric attributes to audience using the visual language.
The system runs with fake data that is generated by keeping the task specifications in mind.
The provided code runs with 11 tasks at the moment but this number can be extended by simply adding more lines to the dataset.
Each line in the data.csv is one time-slice of one task. The header and sample lines can be found below:
task_title, time_stamp, start_flag, end_flag, risk, difficulty, r_hardware, r_software, r_people, r_consumables, r_attire, r_tools
AAO - Stowage Planning,5,1,0,0.4,0.7,,,0.3,,,
AAO - Stowage Planning,7,0,0,0.2,0.65,,,0.25,,,
AAO - Stowage Planning,9,0,0,0.3,0.5,,,0.22,,,
AAO - Stowage Planning,11,0,1,0.1,0.4,,,0.1,,,
In this example, the task AAO globally starts on day 5 and ends on day 11, with two more intermediate reporting steps on day 7 and 9. It uses Hardware, Software, and People as its resources with different utilization levels for each time-slice.
For more information on project details please see report.
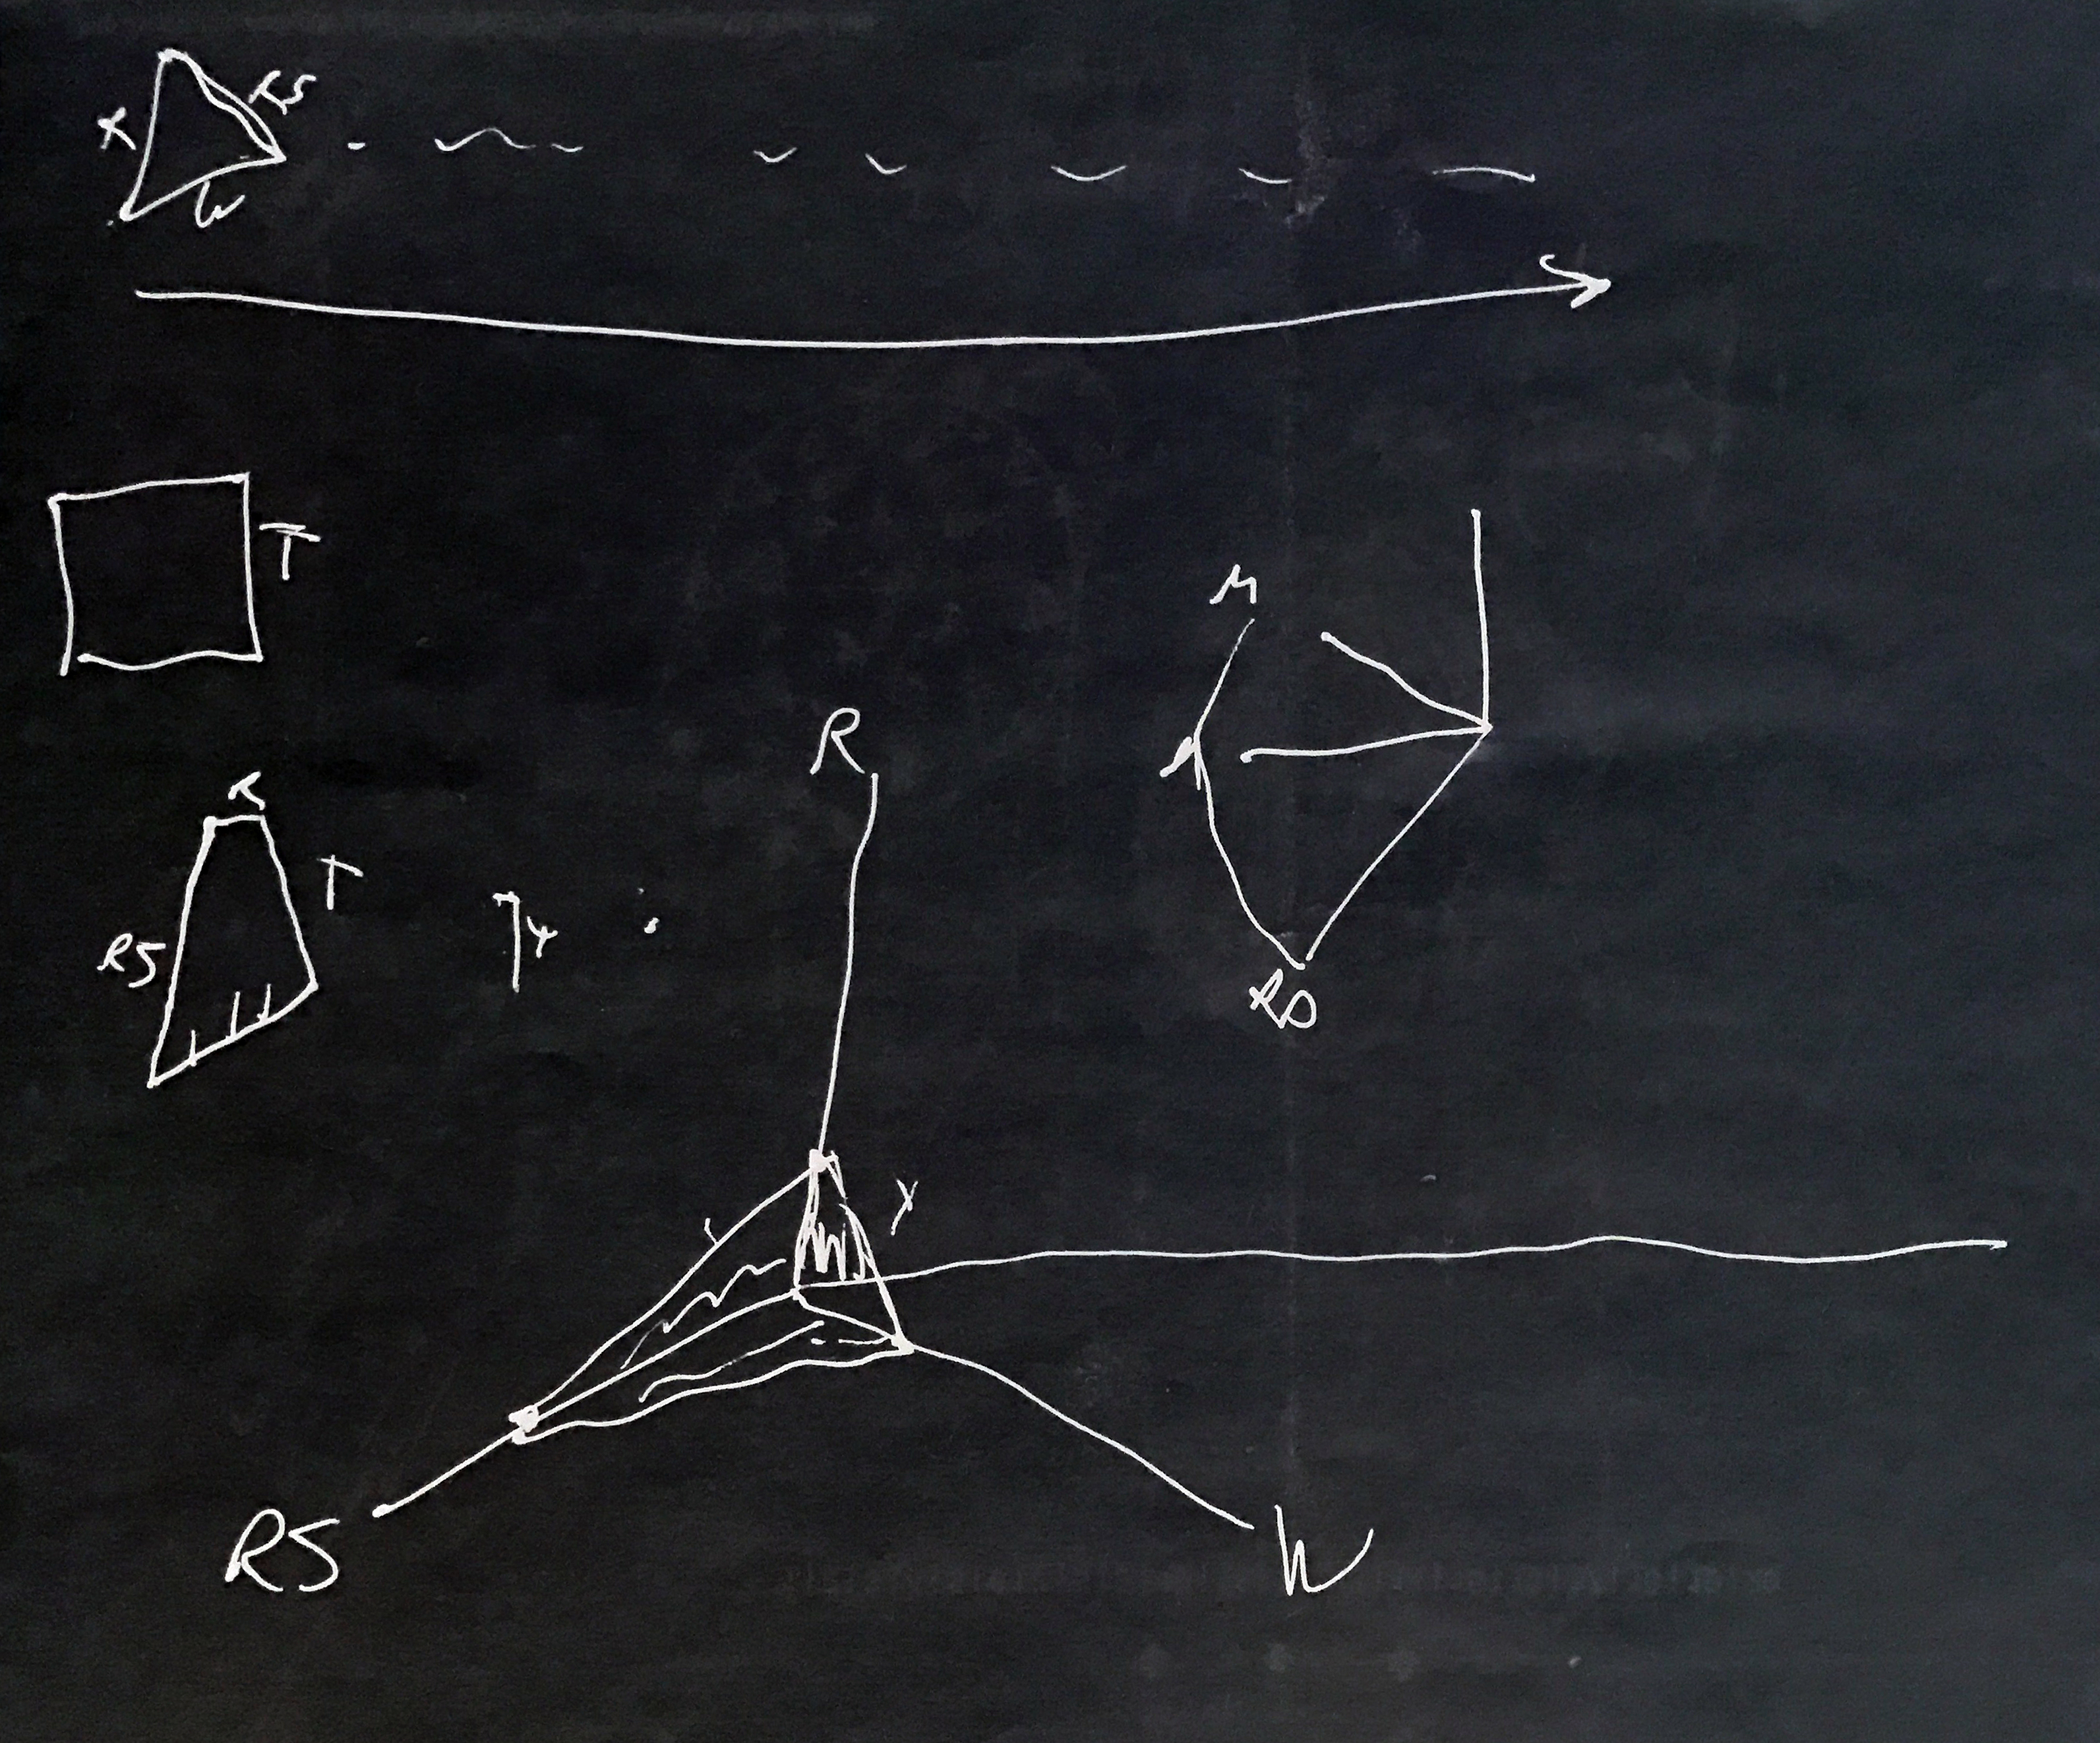
Initial sketches of the design

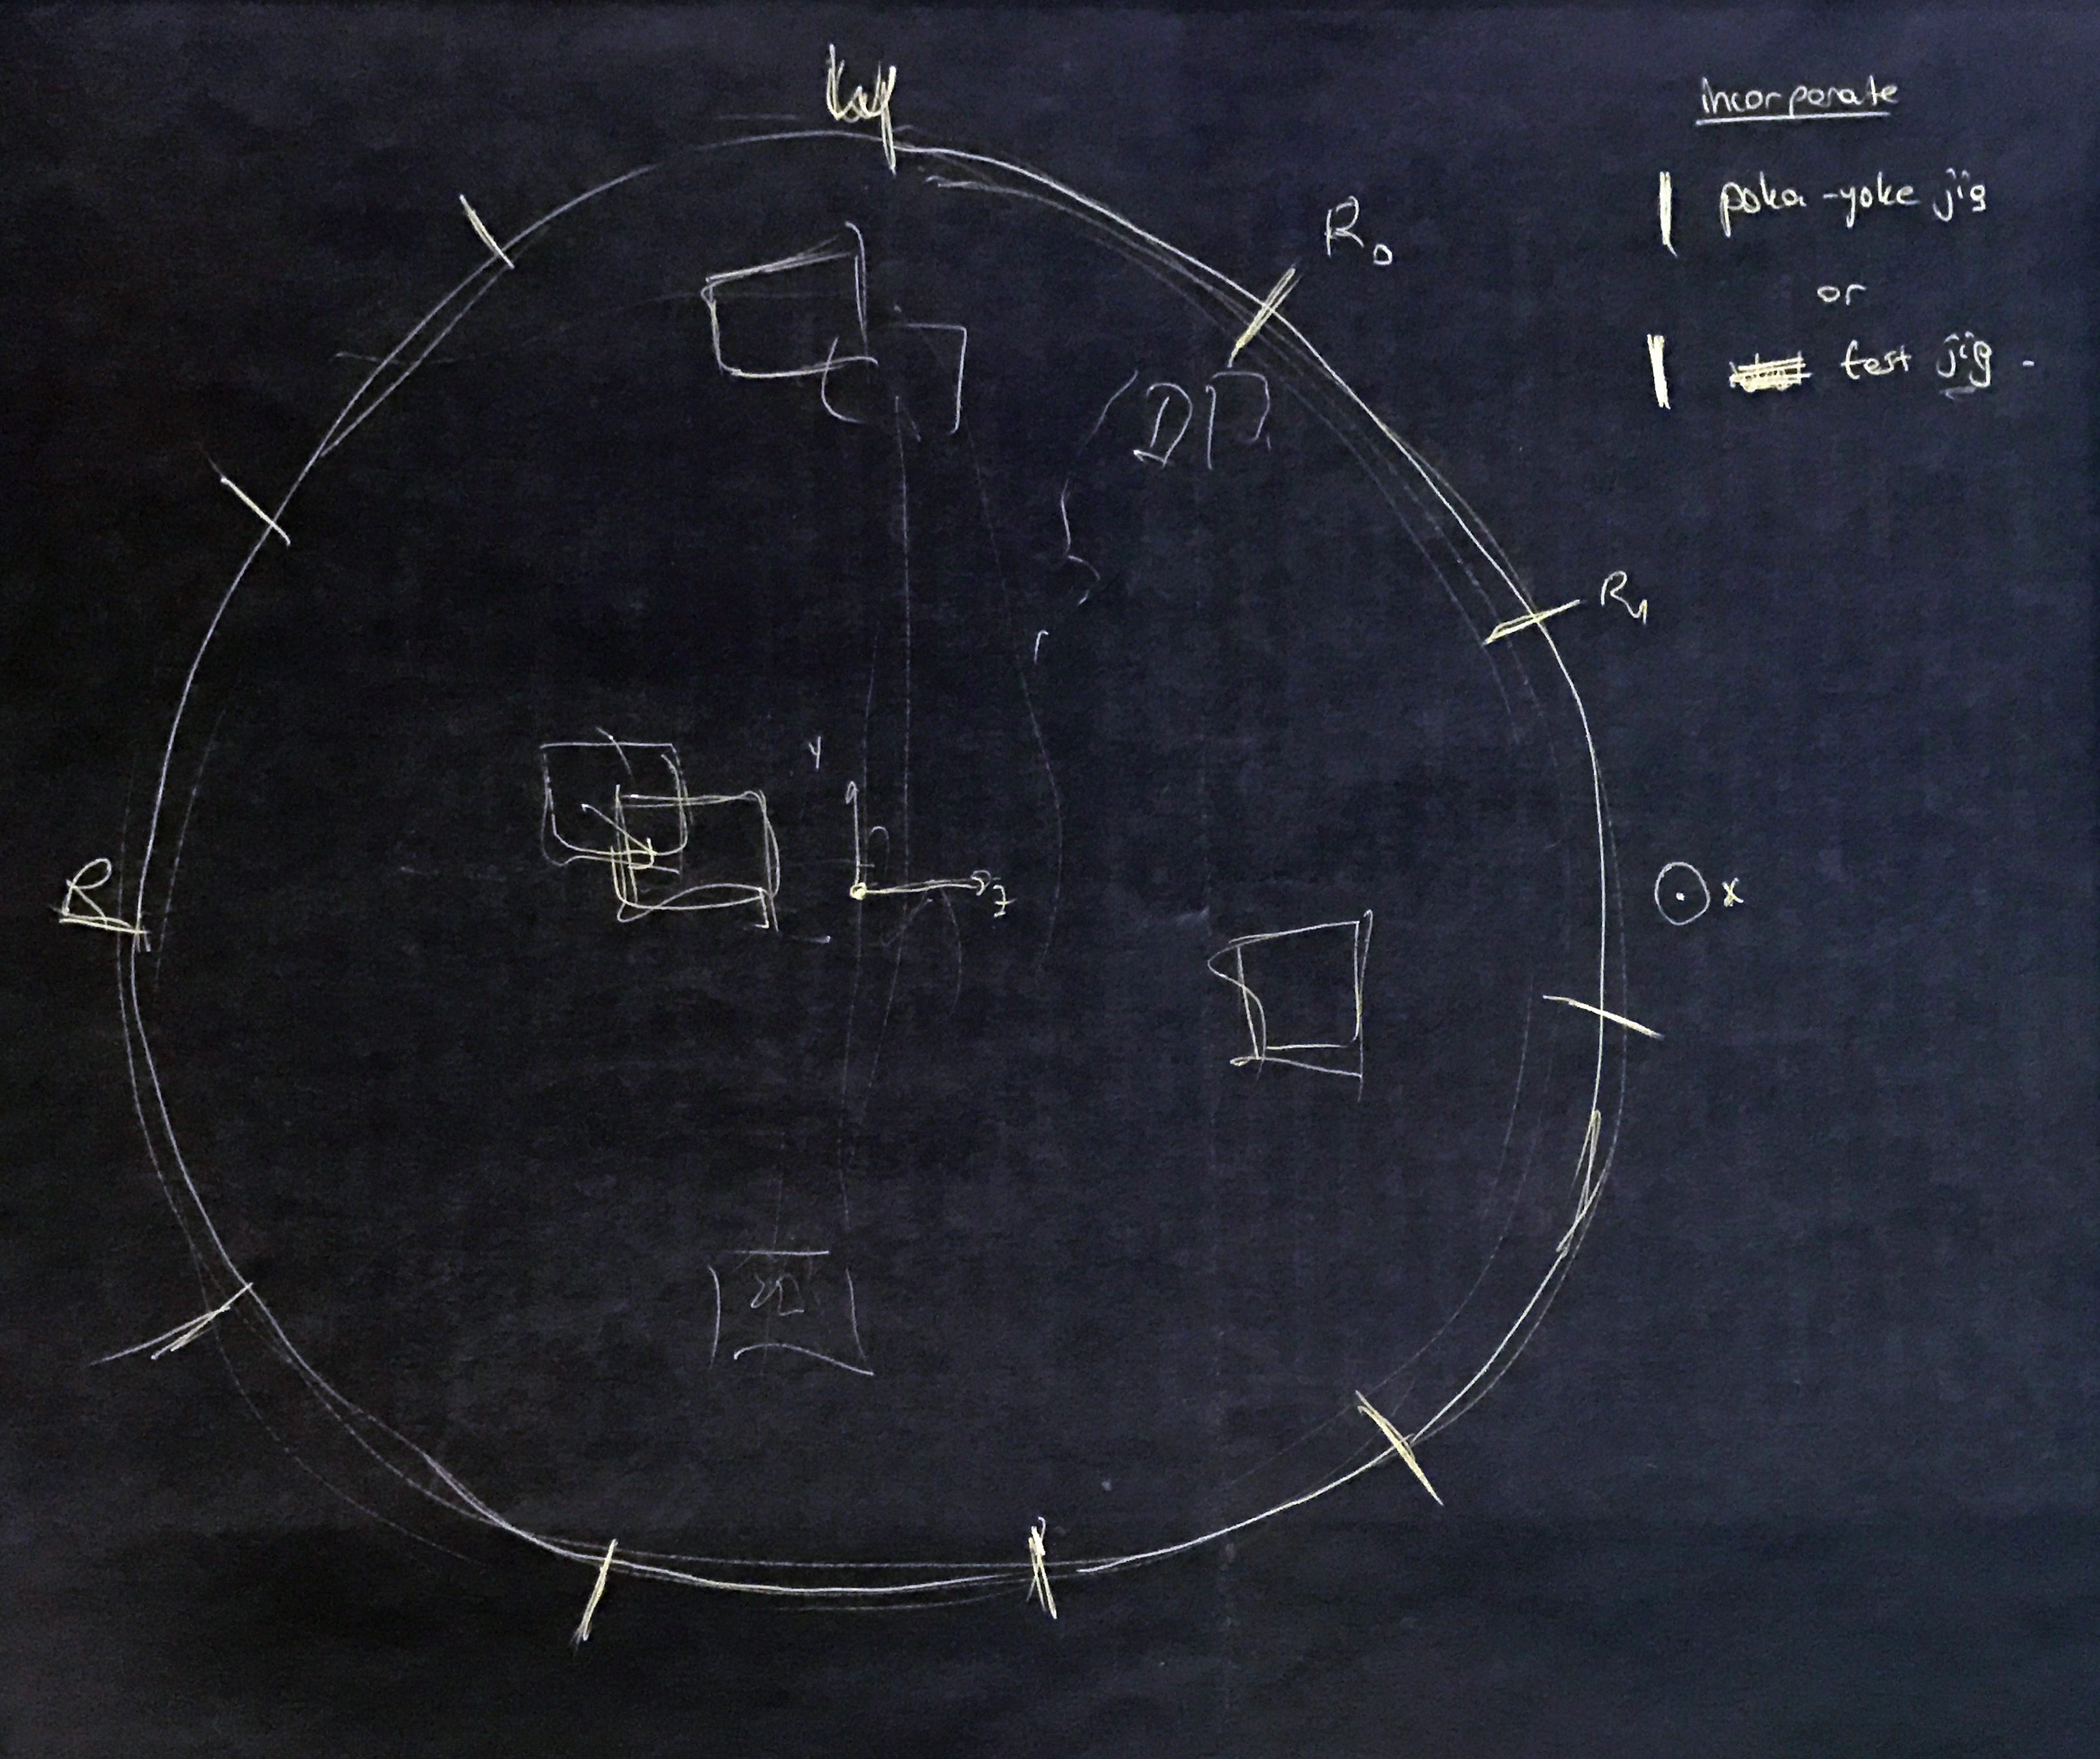
2D slices are constructed using regular polar coordinate system, which gets an angle and a radius. The angle of the element is determined by the number of elements needs to be drawn. So if we have n elements to draw, the angle between each element becomes TWO_PI/n. For the radius value, actual value of the element is used (whether resource usage values, or risk and difficulty values).
The 3D version of these 2-dimensional slices realized by connecting same elements together in 3D space and construction face geometries between them (see sketch1).
Conflicts in the system are defined as the sum of current resource utilization being greater than 1. For instance, at a specific time, if Task A is using Resource A 60% (0.6) and Task B is using the same resource 50% (0.5) since their cumulative usage is greater than 100% (1.0), this instance is classified as a conflict.
In order to select an object in 3D space, bounding box - ray collision gets calculated when user performs a double-click. Since Processing does not provide an unprojection matrix, a different version of the functionality has been included that returns intersection point of the ray in near and end plane.
A Video Animation of the Interaction:
 Line-up view of tasks
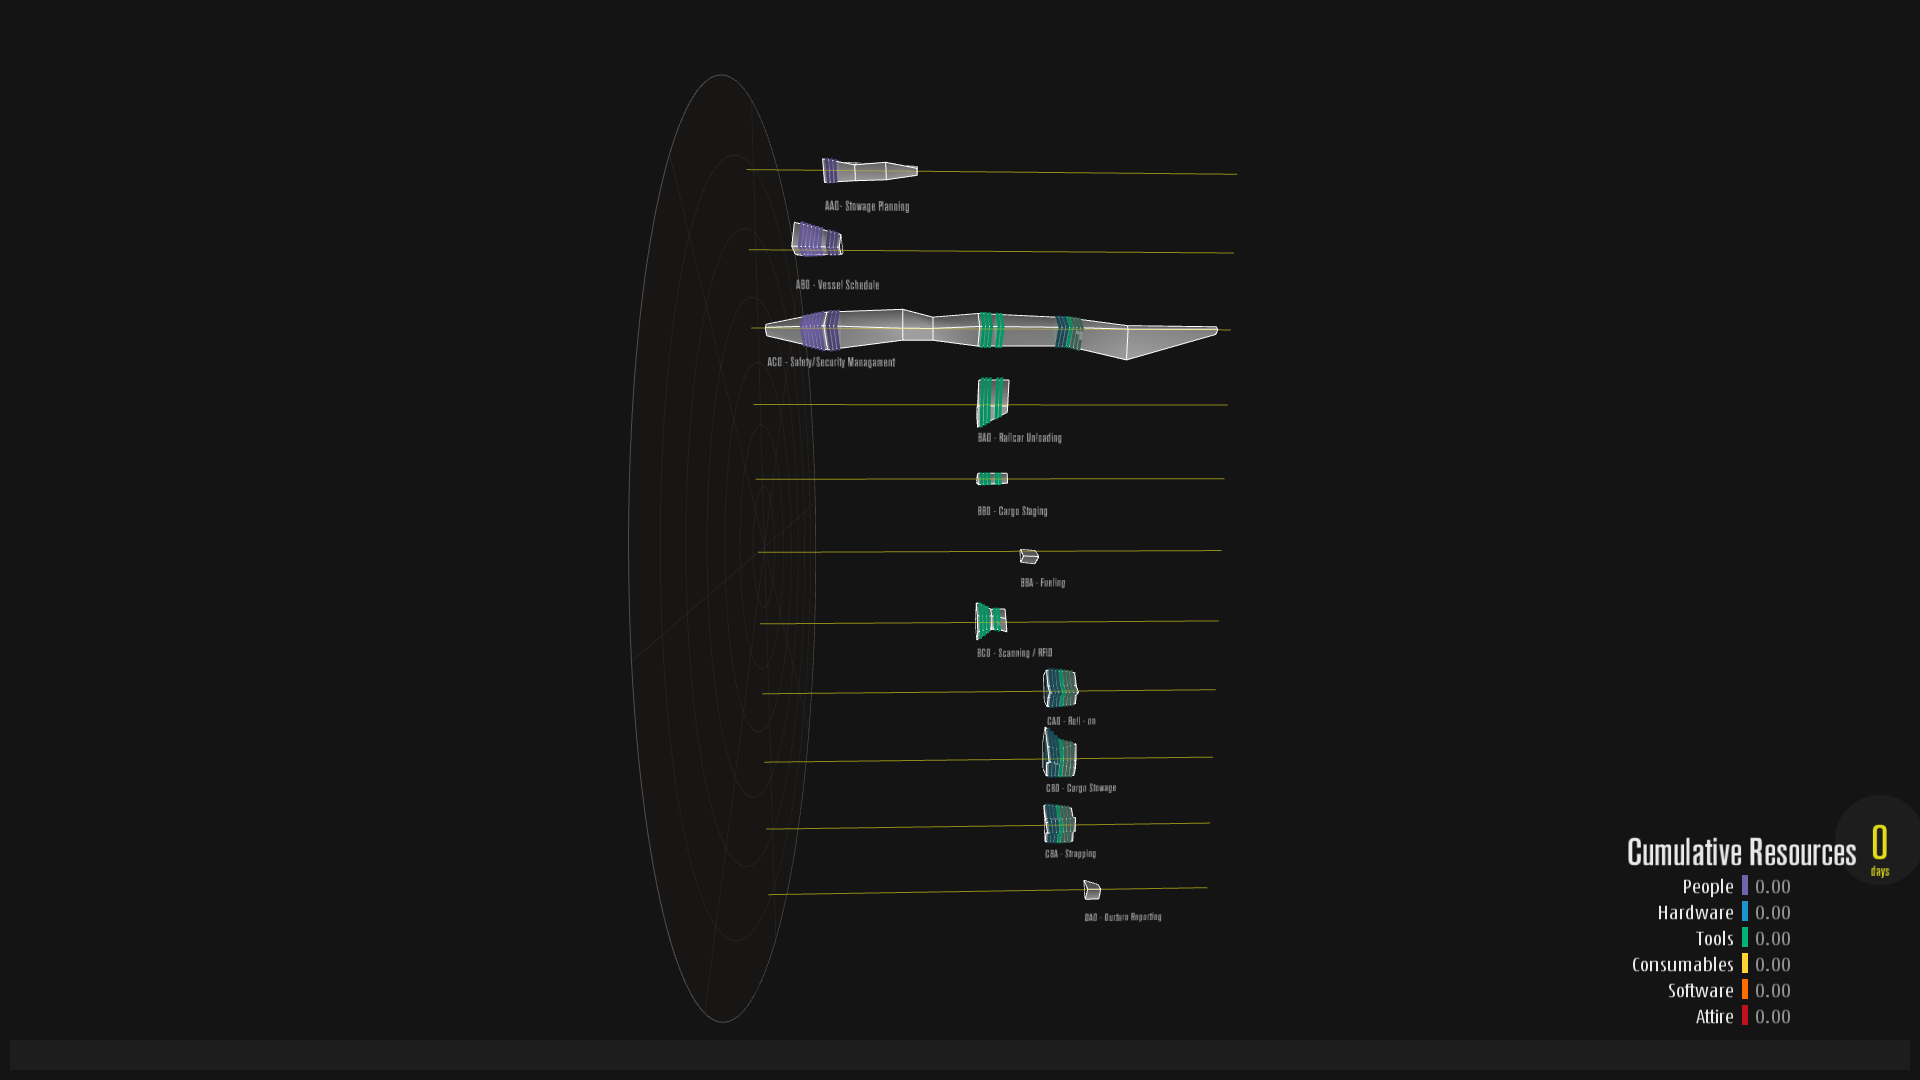 Line-up view of tasks with conflicts visible
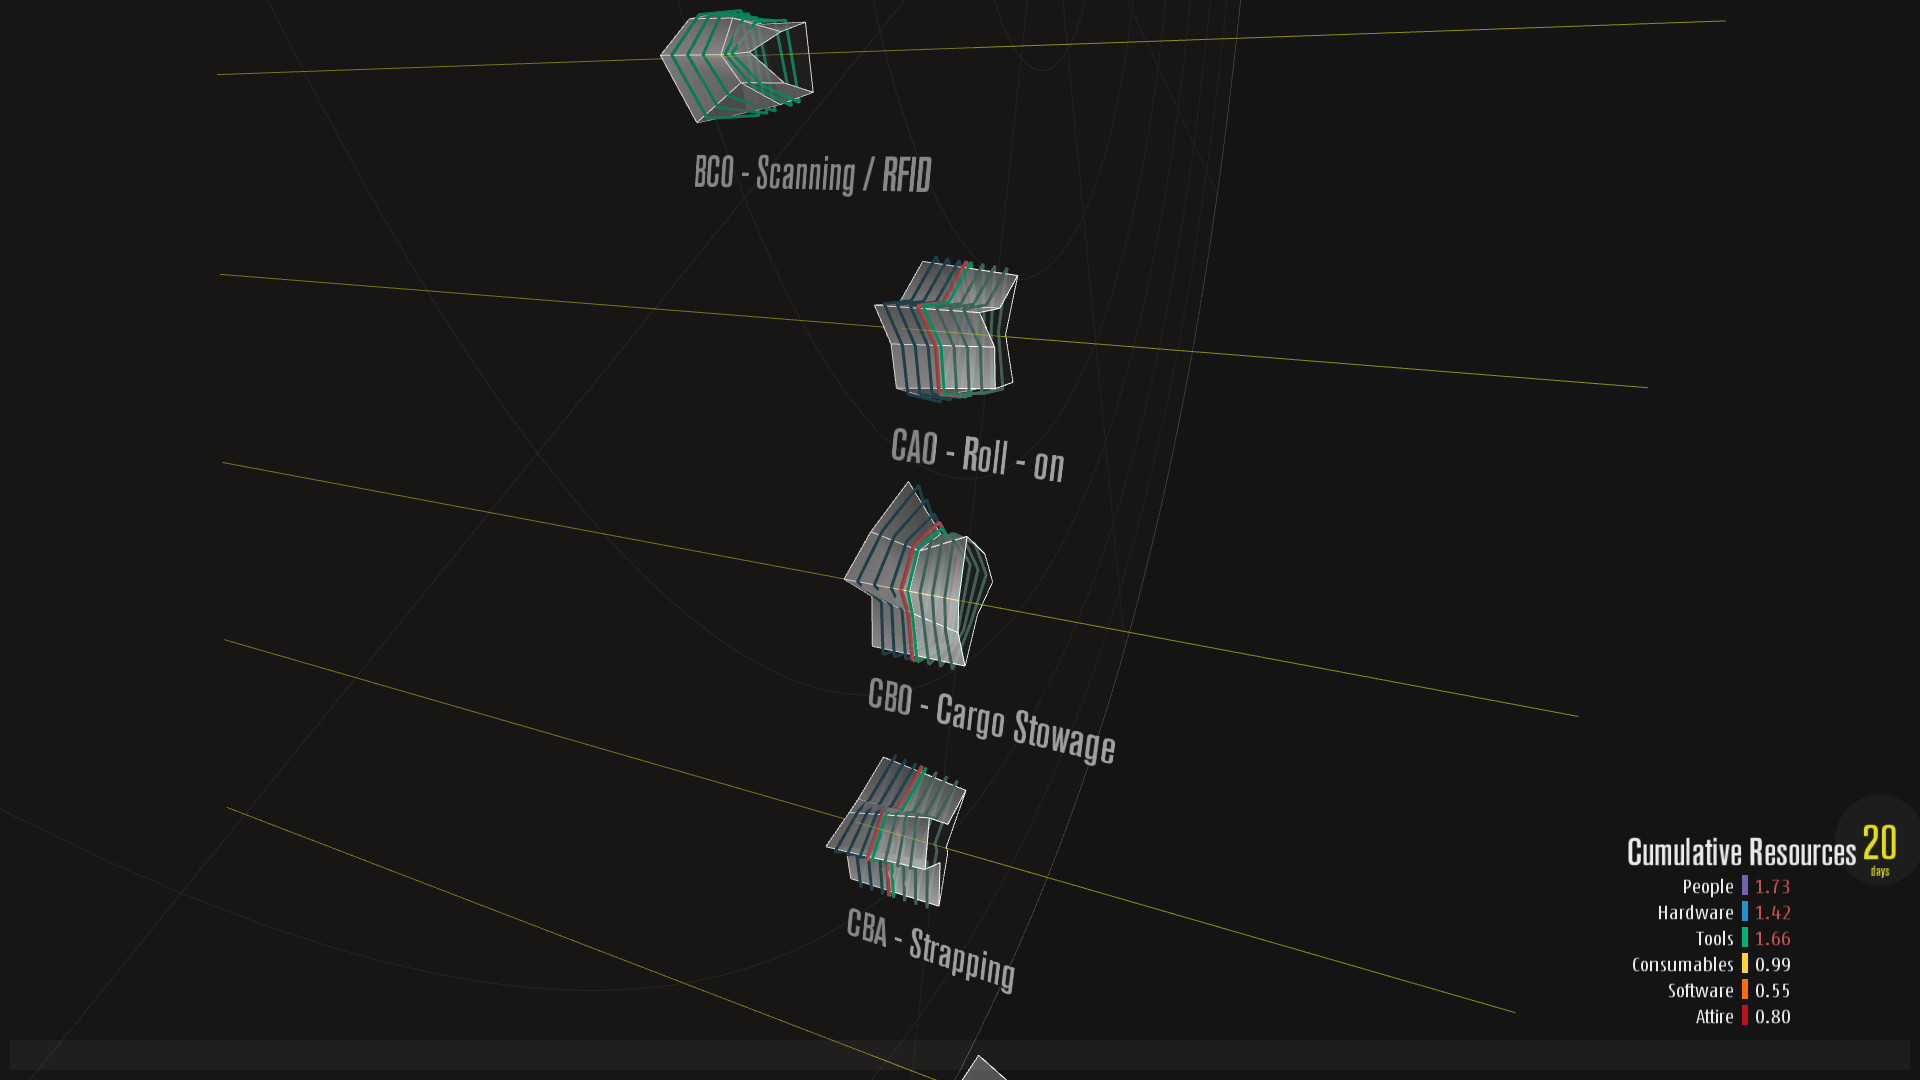 Conflict rings around tasks (green hues) and timer ring (red)
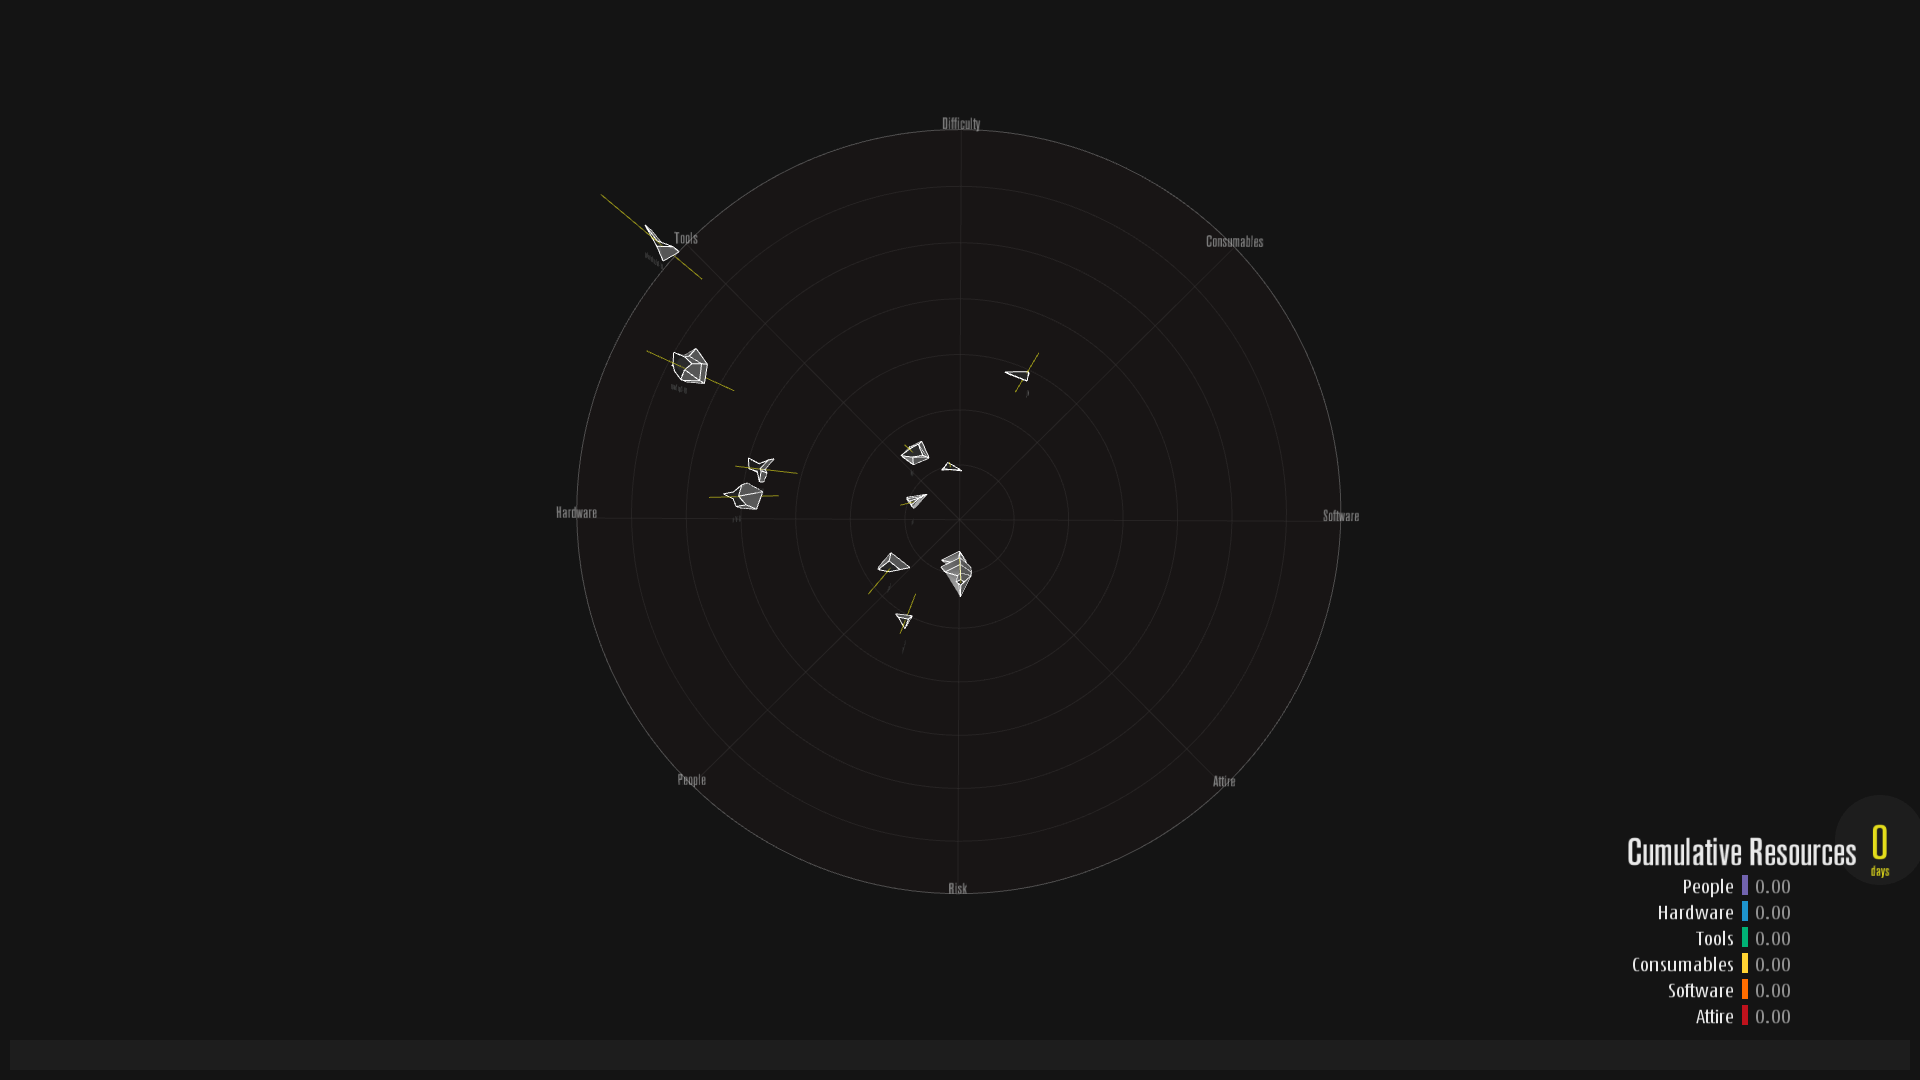 Global polar placement of tasks, from side view
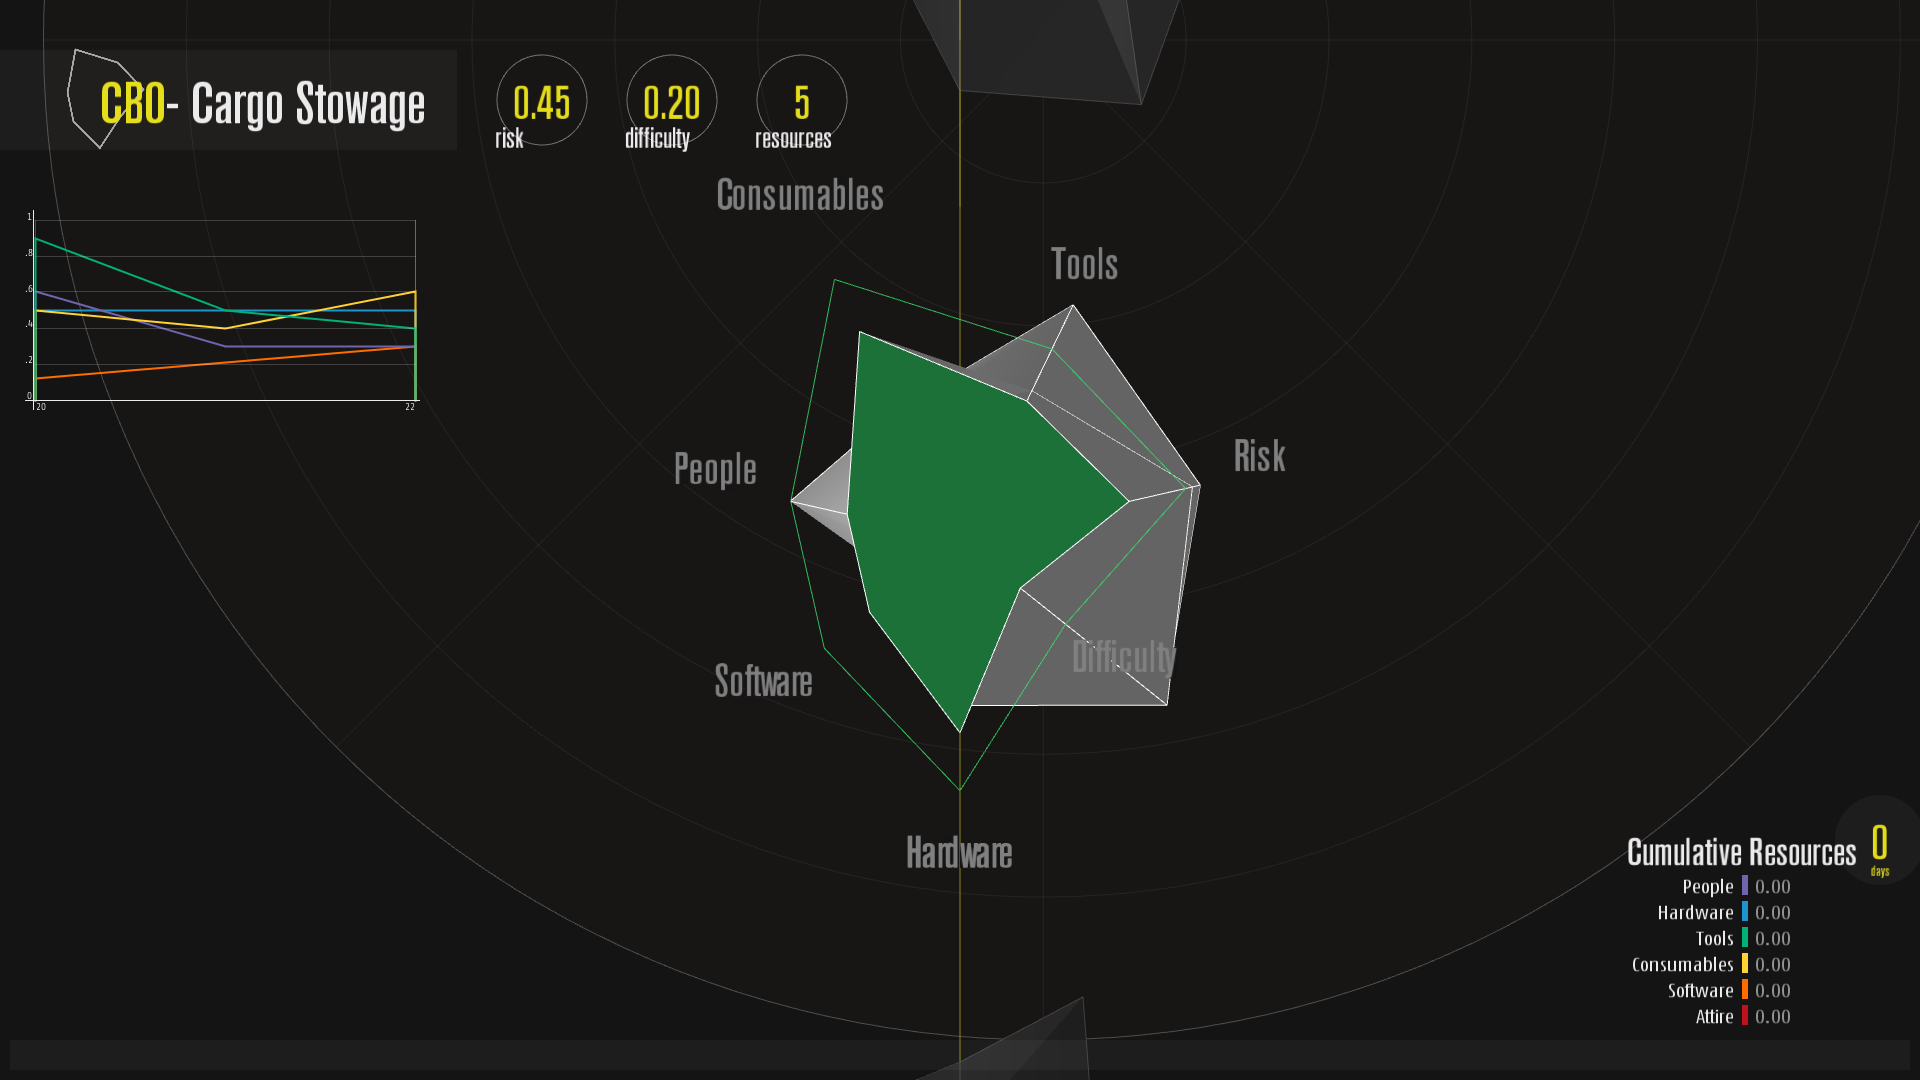 Triple clicked test, reveals details about time-slices
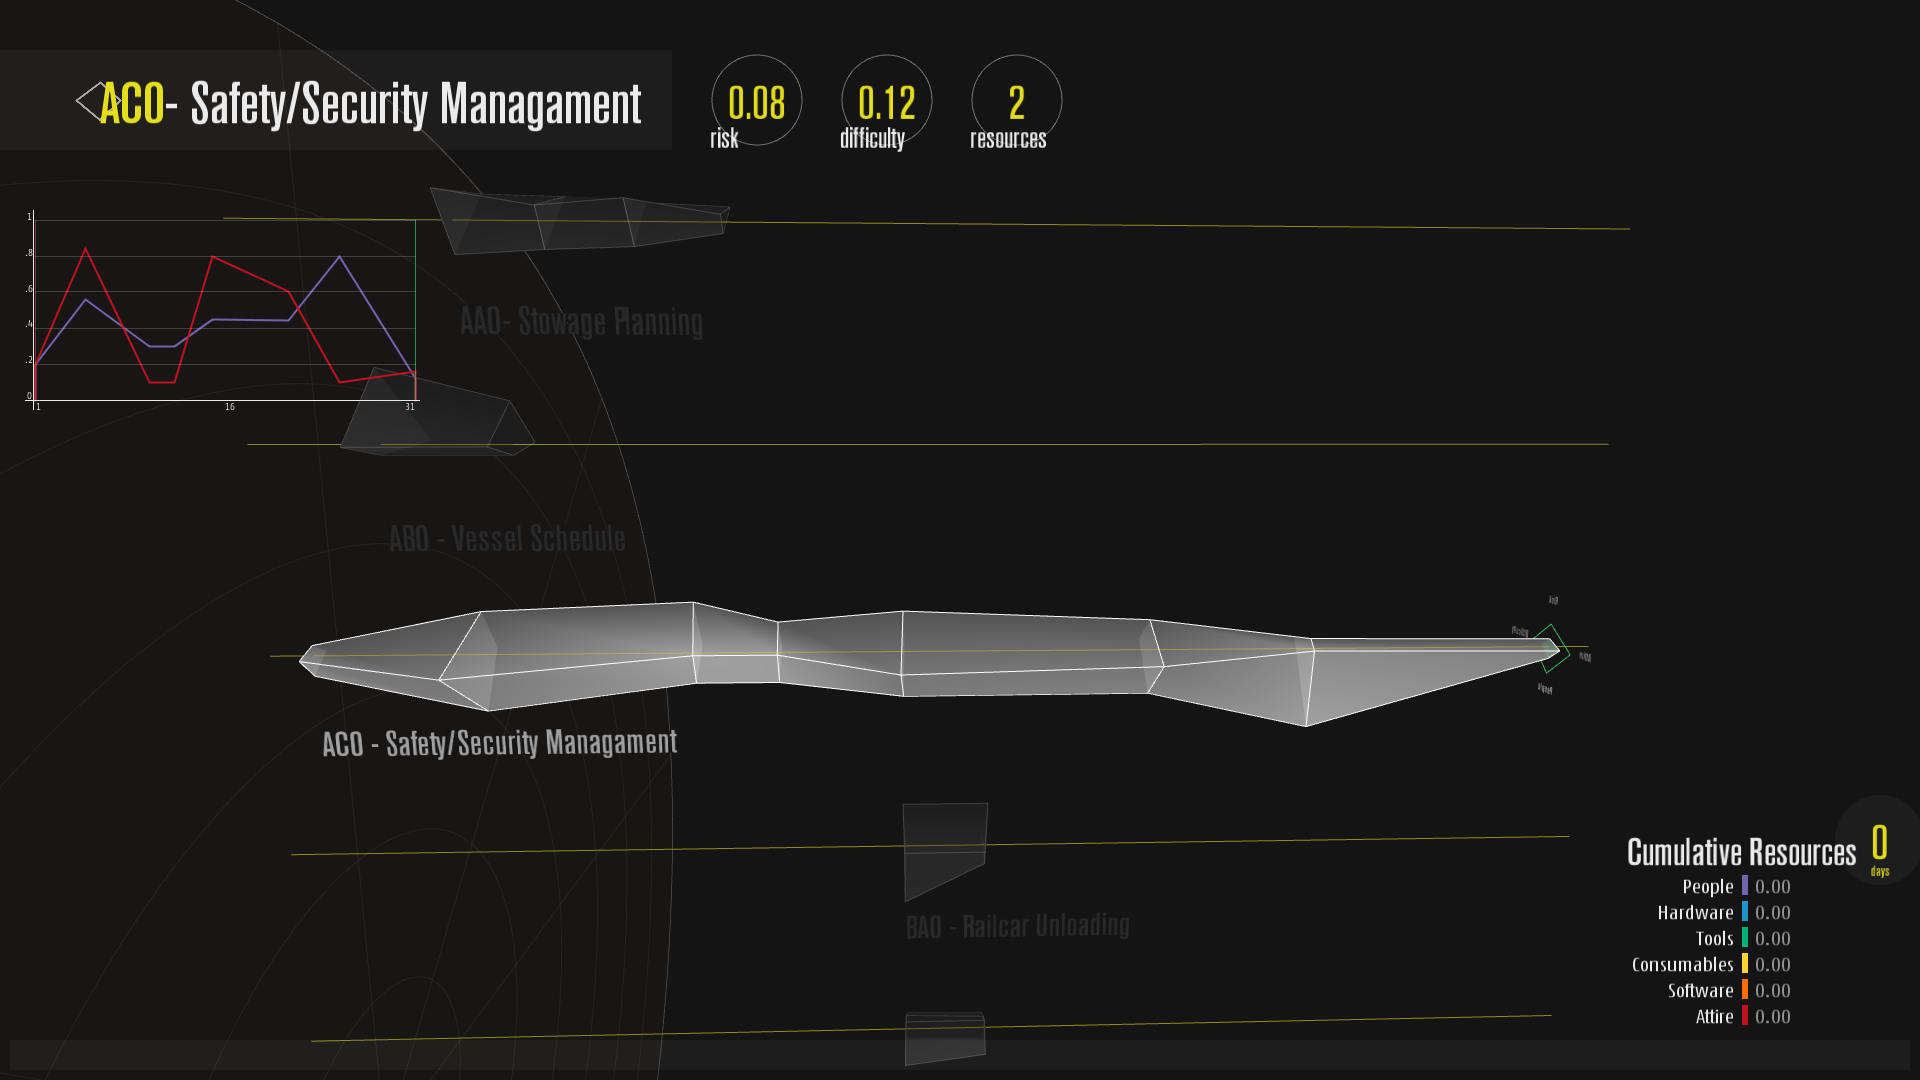 Selected task and its information
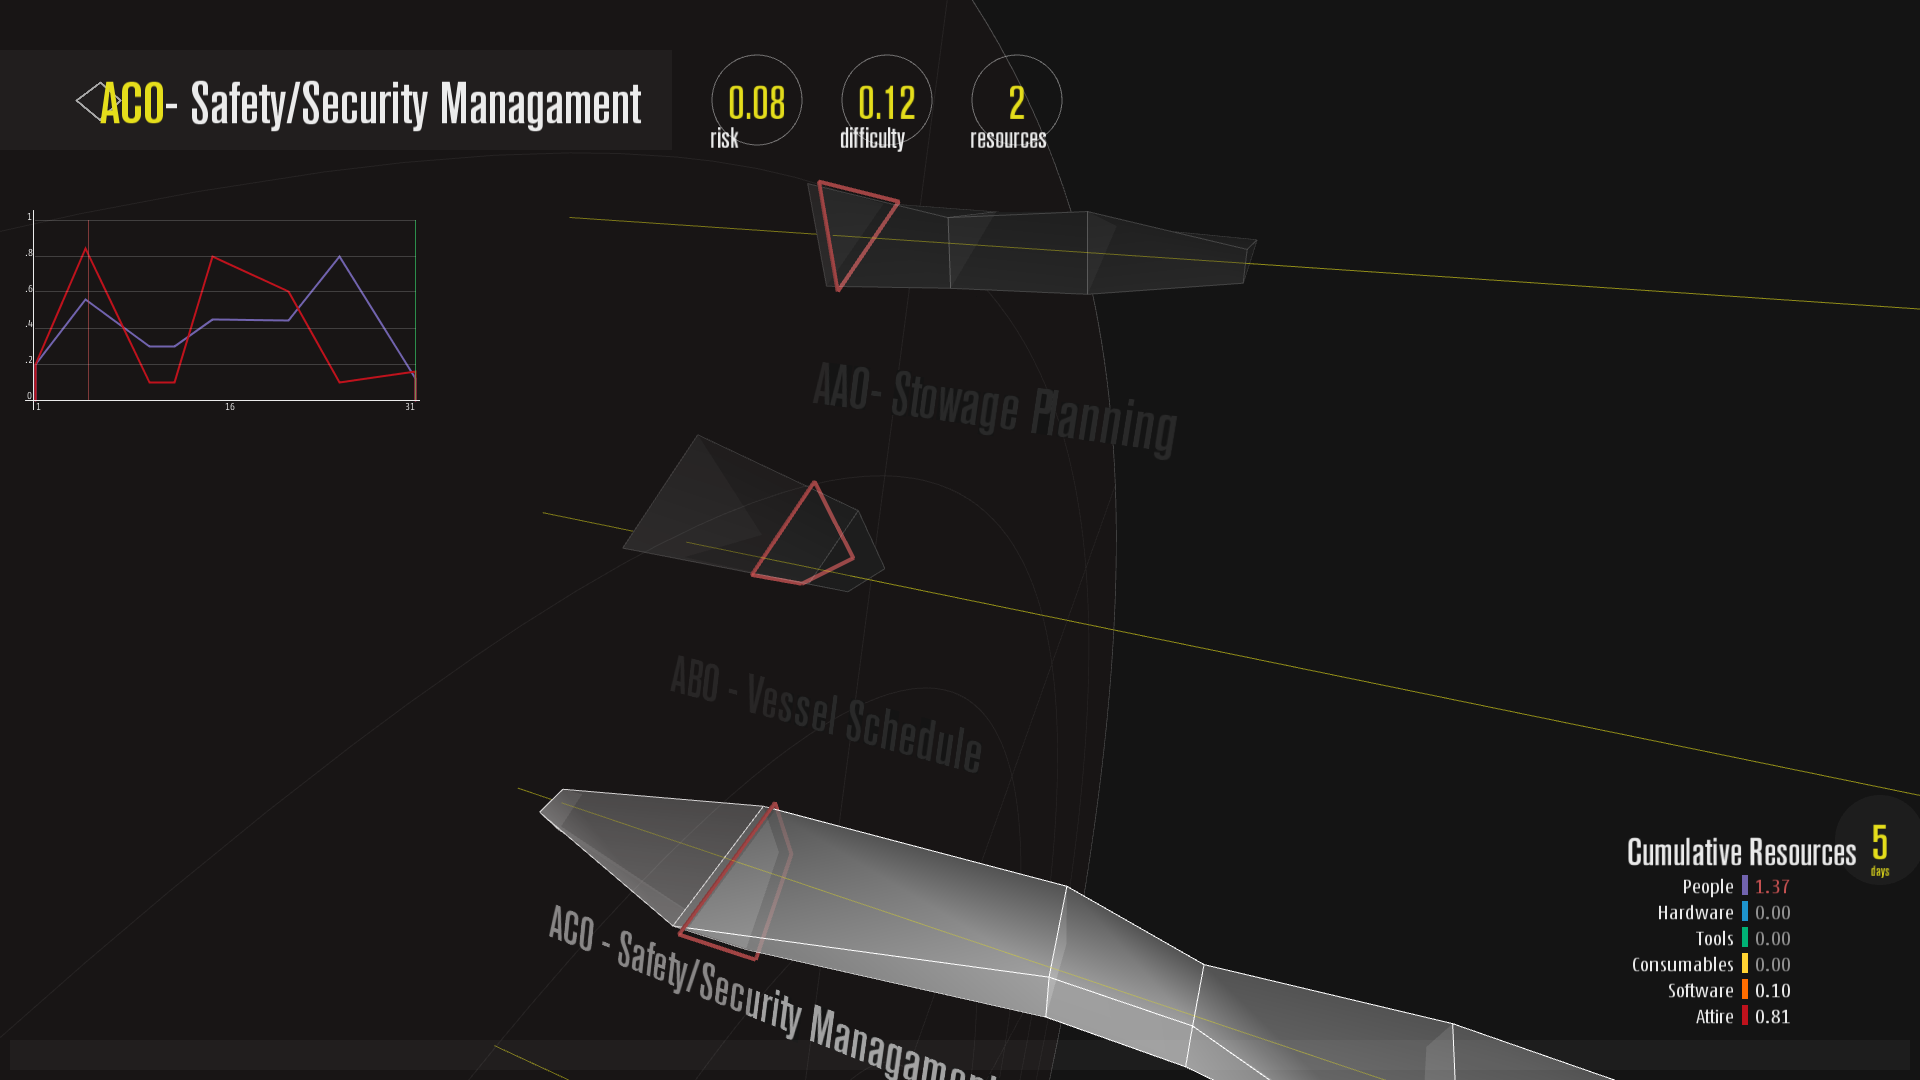 Non-selected tasks gets transparent
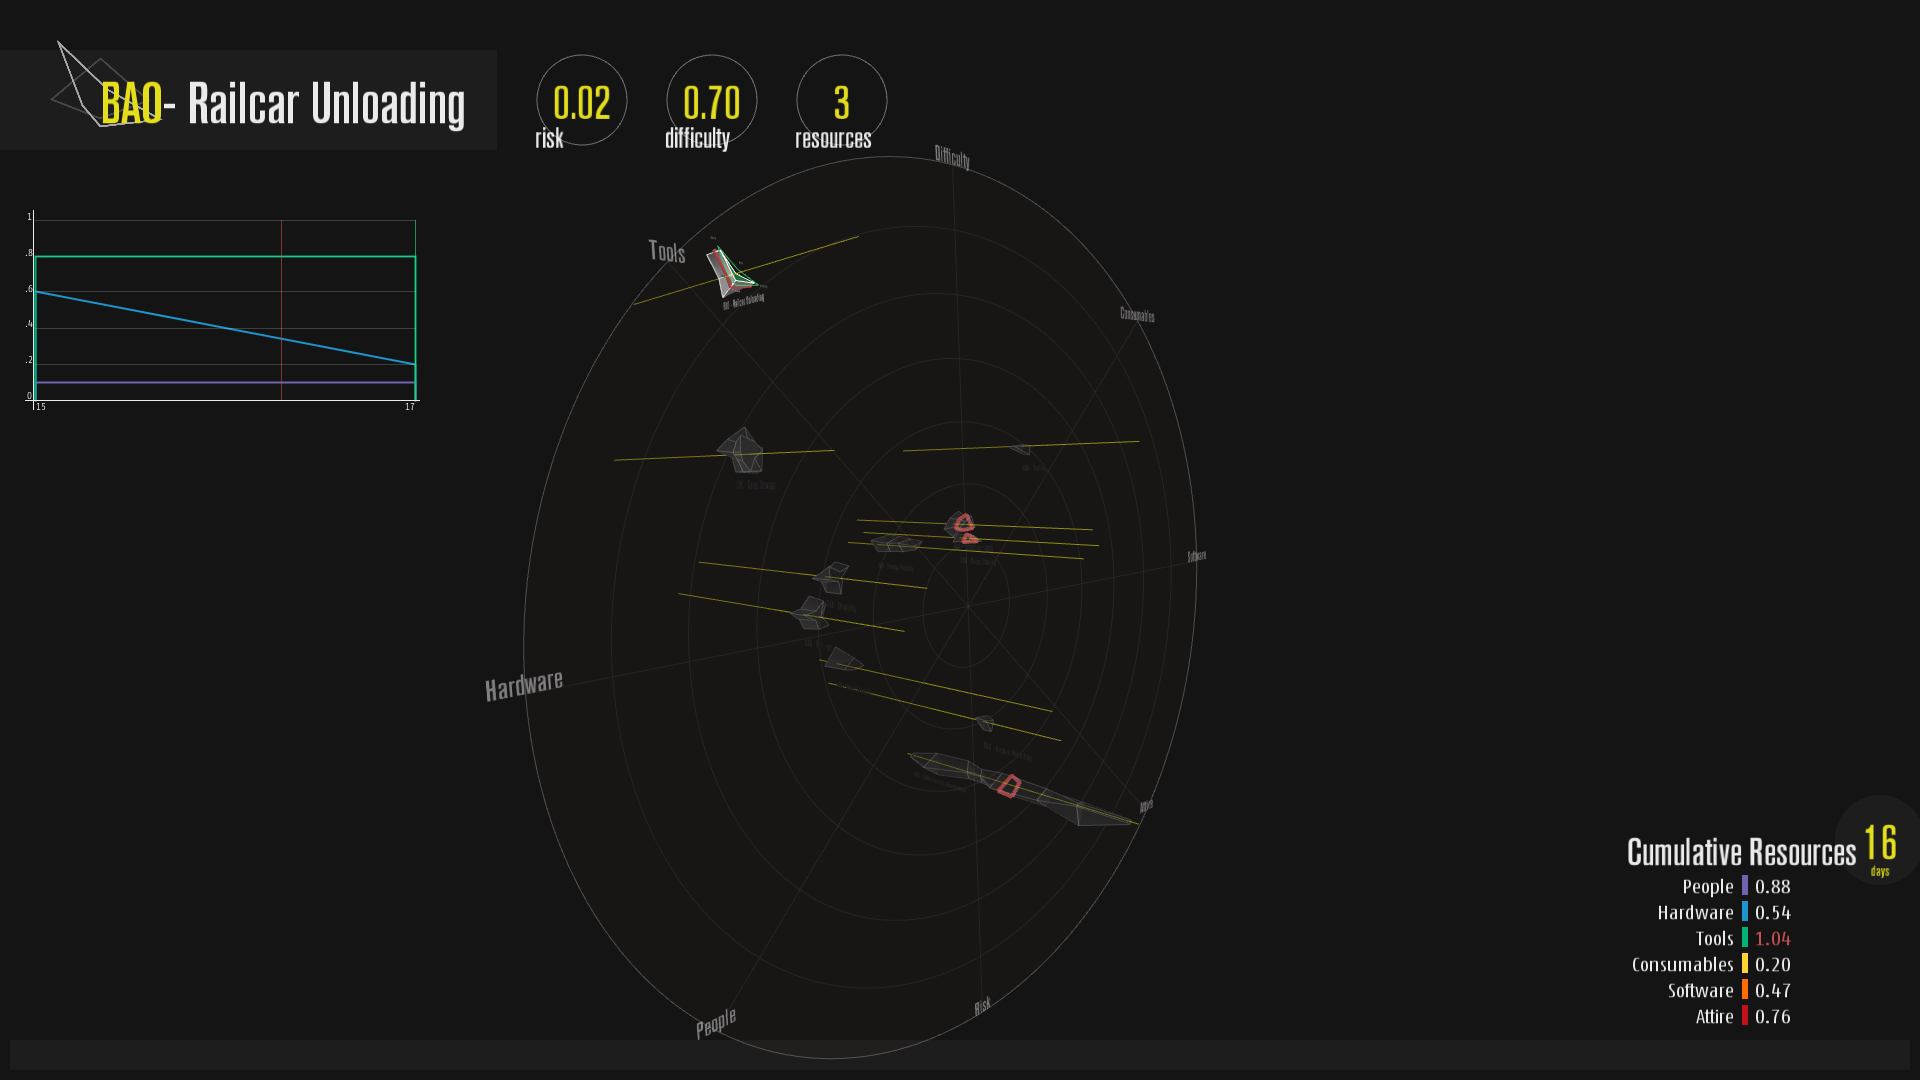 Selected task in global polar placement, from perspective view
The project code can be found here: Bitbucket repo
It needs Processing and Peasycam library