Mat 259 Final | W07 | Anna Knos
The following is a data visualization project proposal
that takes scientific data and, through a singular artistic process, transforms
it into an informative and aesthetically intriguing map. The map is a
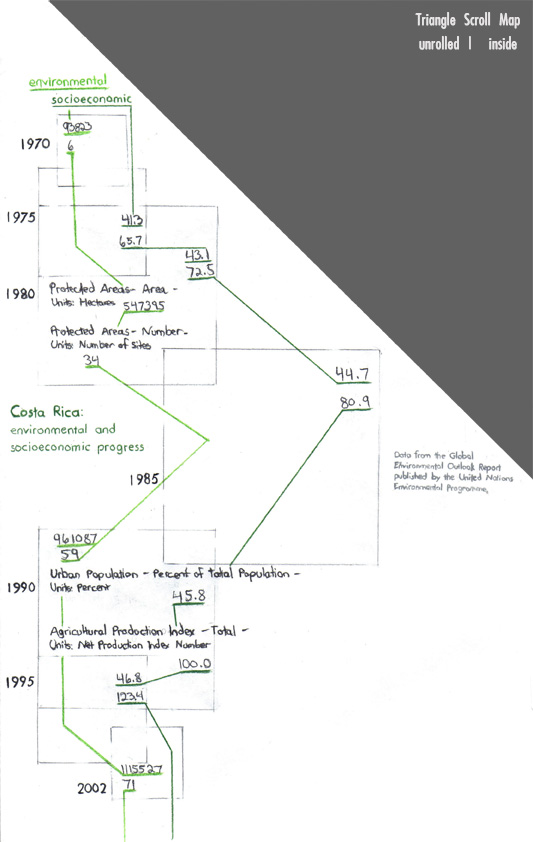
visualization of the growth of Costa Rica's protected areas along side
that nation's socioeconomic advancement. The goal is to show that
environmental and human growth can move in a positive direction together.
Four sets of data pertaining to Costa Rica
from 1970-2002. Two data sets are environmentally focused (protected areas)
and two sets have a socioeconomic focus (population and agricultural production).
All of the data come from the Global Environmental Outlook Report compiled
and published by the 'United Nations Environmental Programme'.
National Protected Areas (IUCN Categories I-VI) - Area - Costa Rica
1970-1980-1990-2002
93823 547395 961087 1115527
Variable: Protected Areas (IUCN Categories I-VI) - Area
Units: Hectares
Data Source: World Database of Protected Areas
Data Provider: World Conservation Monitoring Centre (UNEP-WCMC)
Years: 1970, 1980, 1990, 2002
Copyright c 2002 World Conservation Monitoring Centre (UNEP-WCMC)
National Protected Areas (IUCN Categories I-VI) - Number - Costa Rica
1970-1980-1990-2002
6 34 59 71
Variable: Protected Areas (IUCN Categories I-VI) - Number
Units: Number of Sites
Data Source: World Database of Protected Areas
Data Provider: World Conservation Monitoring Centre (UNEP-WCMC)
Years: 1970, 1980, 1990, 2002
Copyright c 2002 World Conservation Monitoring Centre (UNEP-WCMC)
National Urban Population - Percent of Total Population
1975-1980-1985-1990-1995-2000
41.3 43.1 44.7 45.8 46.8 47.8
Variable: Urban Population - Percent of Total Population
Units: Percent
Data Source: World Urbanization Prospects: The 1999 Revision
Data Provider: United Nations Population Division/Department of
Economic and Social Affairs
Years: 1960-2000
Copyright c 2001 United Nations Environment Programme/DEWA/GRID-Geneva
National Agricultural Production Index - Total
1975-1980-1985-1990-1995-2000
65.7 72.5 80.9 100.0 123.4 137.8
Variable: Agricultural Production Index - Total
Units: Net Production Index Number (PIN) base 1989-91
Data Source: FAOSTAT (Data as of May 2001)
Data Provider: Food and Agriculture Organization of the United Nations
(FAO)
Years: 1961-2000
Copyright c 2001 Food and Agriculture Organization of the United Nations
(FAO)
http://www.barentsinfo.org
The New South Wales 'National Parks and Wildlife Service' created a
map/case study of the 1996 protected marine area that ran along NSW.
http://www.environment.gov.au/coasts/mpa/nrsmpa/development/number33.html
I knew from the start I wanted to make a tangible
map so, over the past few weeks, I sketched out six different map styles
using the data sets to determine the feel of the maps. I moved between
a few different data sets ranging from personal daily map of jarring situations
visualized as a treasure map to a radio scanner (29.0MHz-956MHz) sound
realization visualized as a cartoon dealing with a handful of characters
determined by the sound and 11 environments determined by the band the
sound(s) were noted.
Once I decided to make a map based on Costa Rican growth, I did weeks of exploring the GEO Data Portal, an authoritative source used by the United Nations Environmental Programme. I was attracted to four data sets from two main categories because the collection was historically recent and clearly fell within the scope of my interest.
overcome to complete this project.
Books:
"Maps of the Imagination: The Writer as Cartographer" -Peter
Turchi
"You are Here. Personal Geographies and Other Maps of the Imagination"
-Katherine Harmon
Artists:
Lee Walton
Steve Roden
Cartoon scroll map read from left to right
Treasure map

More of my work can be found at:
www.annaknos.com