2009Spring
Contours
Pehr Hovey
Contours explores the essence of our movement and form by isolating the outlines of passersby and amplifying them on the wall.
A camera tracks movement and converts this to an outline that is rendered using a programmable Laser. Past contours are sampled at short and long-term intervals to capture what the laser sees over time.
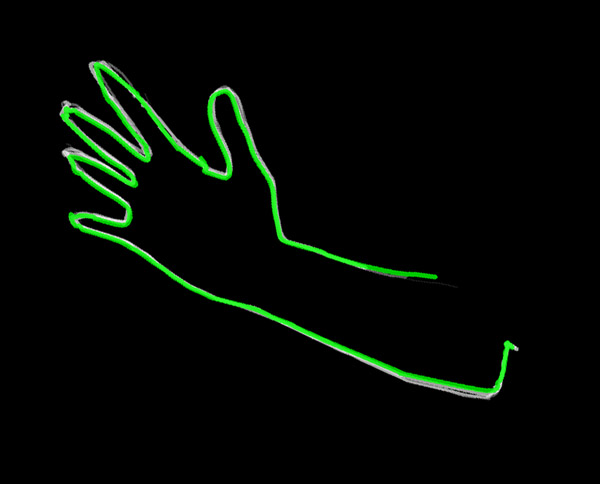
The exacting precision of Laser projection allows for the most vivid representation of our silhouettes.

Contours consists of two custom applications utilizing a variety of platforms and modes of digital transport.
A firewire camera is connected to a computer vision application written in C++ utilizing openFrameworks. OpenCV computer vision library is used to perform blob detection which creates an array of XY points corresponding to the outline of the figure in front of the camera.
Detection efficacy is increased by installing the camera opposite a plain white wall. The wall is also brightly and evenly lit so the subjects appear to the camera as a silouhette which further enhances the quality of the resultant blob.
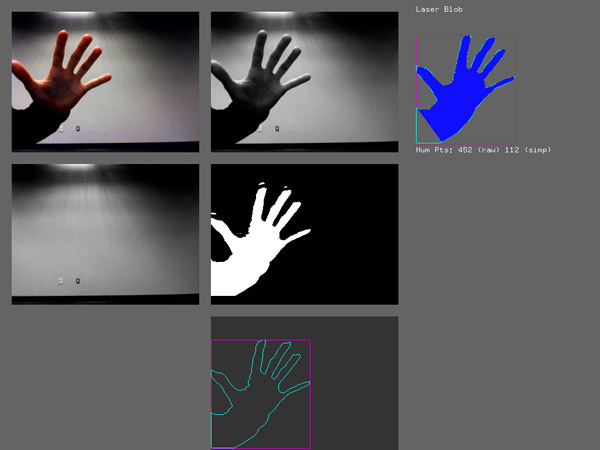
The blob is simplified using the Ramer-Douglas-Peucker algorithm which reduces the number of points needed without modifying the overall appearance. This reduces transmission bandwidth needed to increase system performance.
The blob is transmitted to the Laser program via Open Sound Control as a stream of XY points.
The Laser program is written in Java utilizing the Processing framework for visual feedback. This program receives laser coordinate and color data via Open Sound Control and sends it to the Laser via USB. The Laser program also manages the projected visual feedback.
Contour history is displayed in three modes corresponding to differing timescales: Immediate, Timeline (short-term), Grid (long-term).
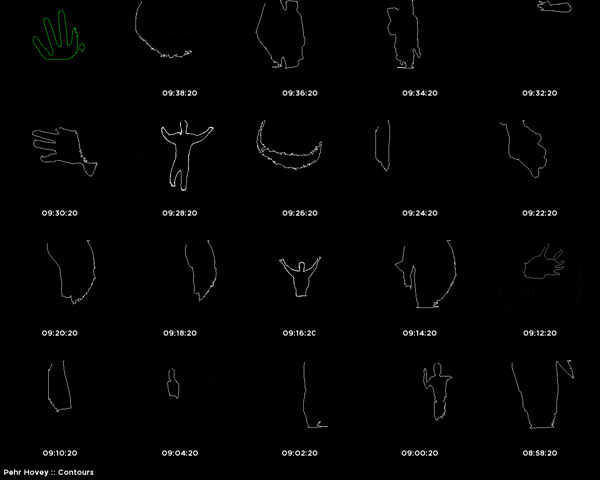
The immediate display shows the five most recent contours in full scale. Depending on how fast the subject moves you can see trails as the shape changes.
The timeline shows the live contours on a timeline along with past contours sampled every thirty seconds.
The grid shows the live contours along with contours sampled every two minutes. A filled grid shows about half an hour of contour data.
Each contour sampling is a sequence of several contours that play back as a mini animation to depict both the shape of the contour and the change over time. Each grouping represents a few seconds of contours.
As different people interact with the system in different ways the grid fills out with a variety of movement and forms.
http://pehrhovey.net
Technology:
http://openframeworks.cc
http://processing.org
http://en.wikipedia.org/wiki/Ramer-Douglas-Peucker_algorithm
http://sourceforge.net/projects/opencvlibrary/
http://www.prolaserfx.com/
Prior Art:
http://www.nuagevert.org/
http://www.hiroyamagata.com/exhibition/
http://www.evdh.net/lsp/index.html