headlines and checkouts for September, 2008
Matt Hubert
For Project 1, I explored the potential correlation between the amount of items checked out per category for the month of September and the most popular news headlines of the The Seattle Times. On the top of the fold, there are the news headlines with a red line indicating its significance, measured by the word count and the proximity to the front of the paper. Originally, I modelled significance with text size, similar to a tag cloud. This feature still remains, but is not on by default.
Below the fold are the total number of items checked out per day (in the upper right) per category or subject. Category is the original Dewey Decimal category given to the item, and subject is the library-given subject within the XML data provided from the SPL. An item can have multiple subjects, but only one category. (Think of categories as a sorting mechanism and subjects as tags.)
Every item in each major category—that is, the integer value of a category (e.g., 741.2353 -> 741)—is given a unique color. The color is an explicit base color for the 100s place, plus the remaining values to make it brighter. For instance, the 700s are defined as red. 701 would be a dull red (the base color), and 795 would be a bright red (red + 95). The subjects are not color coded, because I saw no simple way to do so with any meaning.
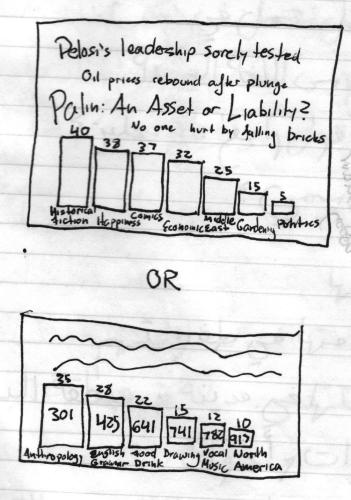
The original project sketch:
In order to get the news headlines, I used a tool called LexisNexis. It allows you to search any newspaper (among other sources) for any type of article over any period of time. I selected The Seattle Times and chose September 2008, without any additional search terms. From there I was able to select the articles that were meaningful (no sports, no other miscellanea), and download a text document with the headlines, the word count, the author, and the original page.
Finding an actual correlation between the headlines and checkouts is difficult without a mathematical backing. But I have noticed some potential correlations: See September 6th and notice the "Financial Economics" section in the top 10 along with the headline "Major indexes down for the week". "Financial Economics" only appears in other days with financial news.
Anyway, enough talk. The applet:
keyboard controls
Source code: Project1 Headline Transaction TransactionUtils
Built with Processing