Comparing the number of library checkins & checkouts
Pehr Hovey http://pehrhovey.net
MAT259 Data Visualization Winter 2009
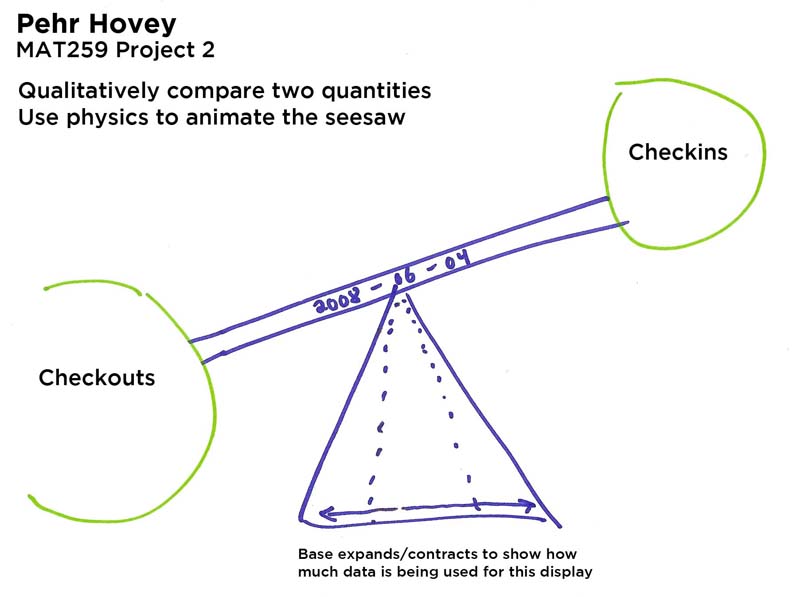
The visualization below explores the relative balance between the number of library checkins (left) and checkouts (right) during one day.
The familar metaphor of a see-saw or balance was chosen since users are able to quickly understand which quantity is greater and by what proportion.
The timeline also depicts this balance as a function of time so the daily trend can be observed.
Hover the mouse over the timeline to investigate specific points during the day.
Pressing Spacebar will replay the loading animation. Keys 0-7 will change the color scheme.
Concept Sketch:
Source code: proj2_export BalanceBeam BalanceObject BalancePivot Integrator Timeline Transaction TransactionUtils
Built with Processing