Culture
MAT 259
Qian Liu
Cellular
2D Frequency Mapping
2011W
Amazon, Starbucks and preforming Arts.
Seattle owns numerous numbers of of famous Internet, technology and software companies.
http://en.wikipedia.org/wiki/List_of_companies_based_in_Seattle
Seattle owns the original Starbucks and is famous for coffee industry.
Seattle has been a regional center for the perfuming arts for many years.
This project is based on the interest of giving the data a "local" meaning rather than just treat it as general data. Since most of the people who is using the library should be local residents, Culture Cellular tends to find out the relationship between the books being checked out and local residents' interest. Four identical topics have been chosen for this visualization: technology(Medical science), Arts(performing Arts), Food and Drink and Economy as they all have a closer relationship with the city -- seattle.
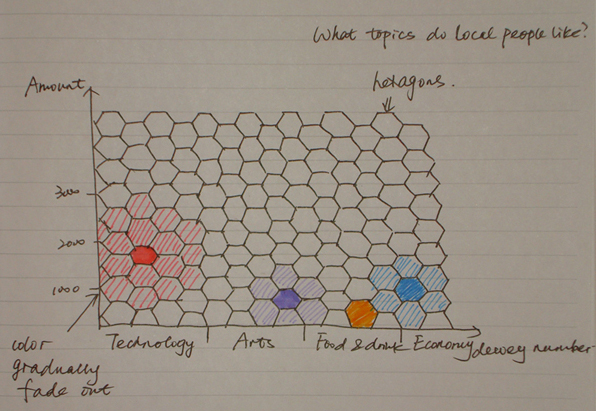
Initial Doodle
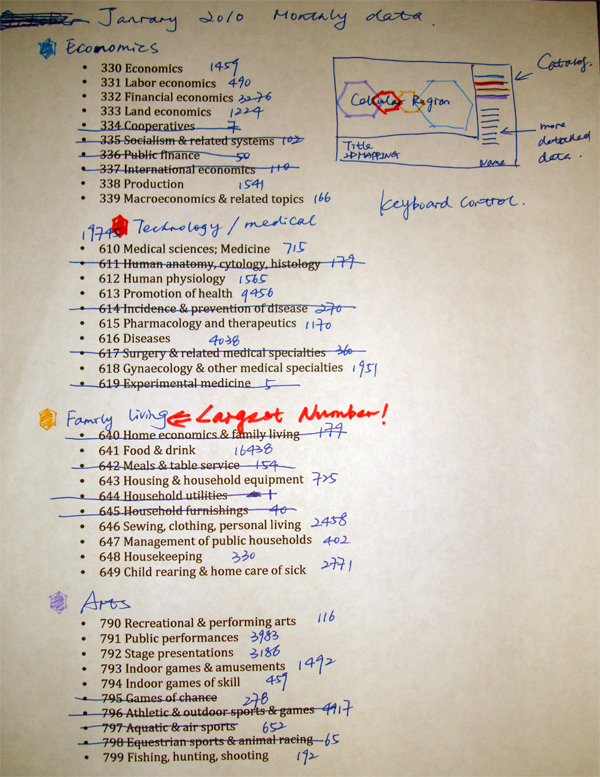
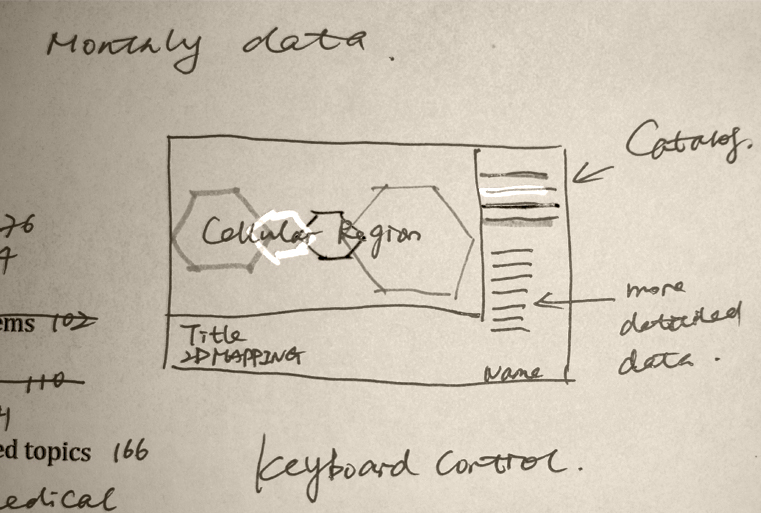
Find the best way to display the data:
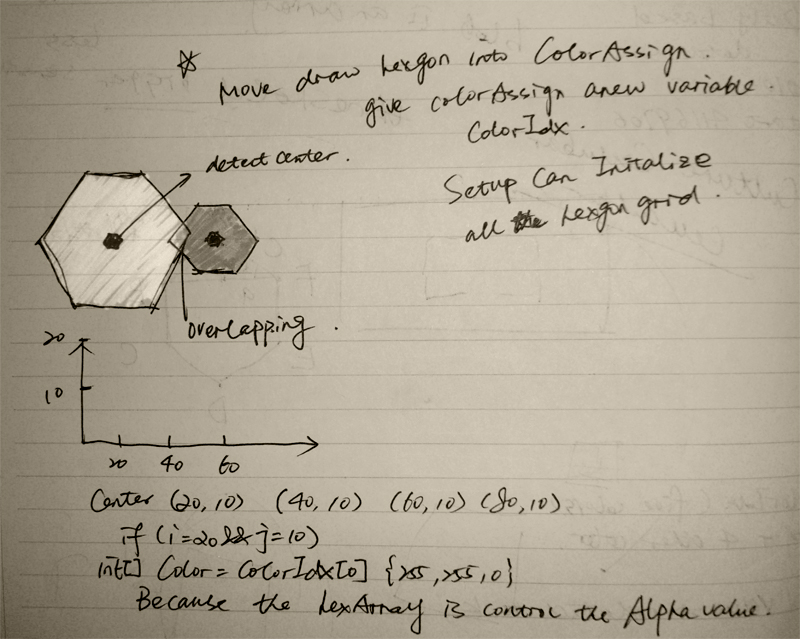
Coding and Solve techinical problems:
Choose color panel:

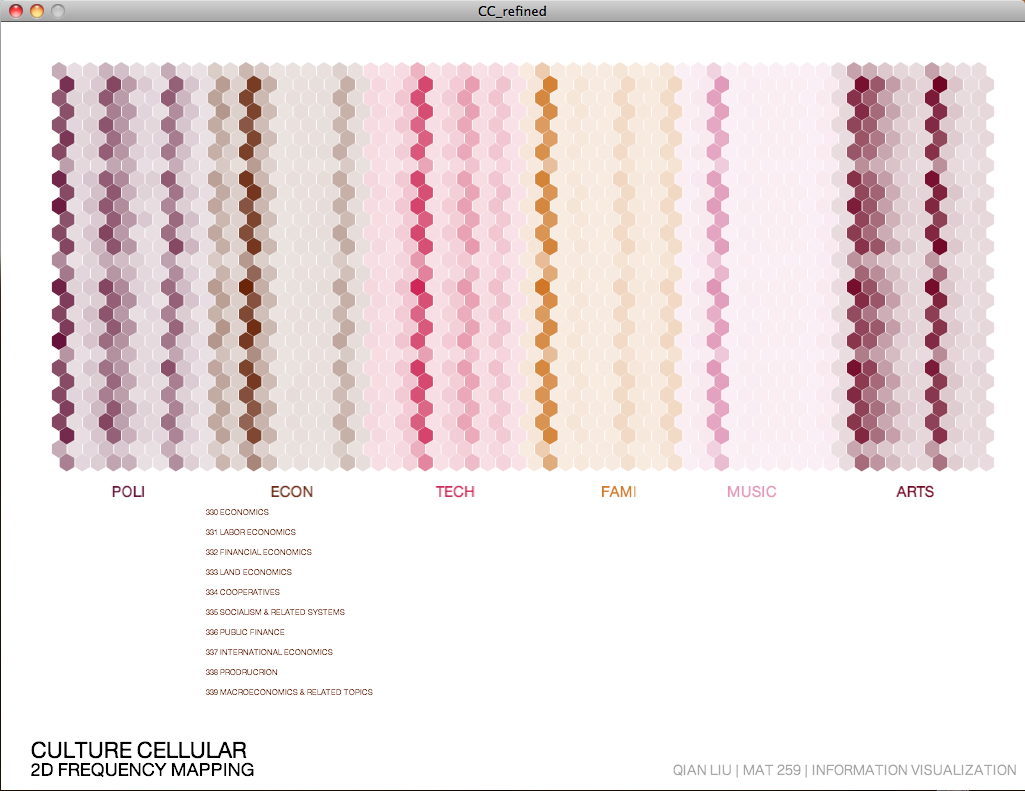
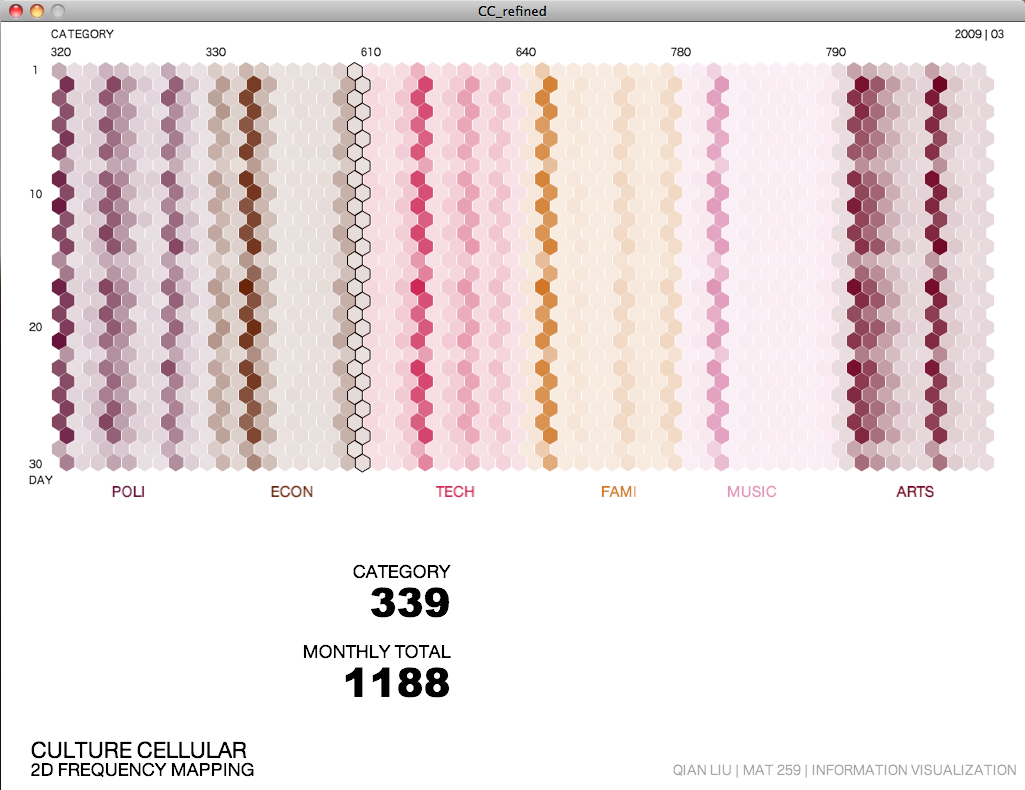
From different perspectives, two versions of visualizations have been maked. VERSION I tends to get a general idea about the book numbers of different categories and is using a daily based data. VERSION II has a more detail way approaching the data, althought using a monthly based data, it compares different daily data from each subcategories. Based on the checked in books number, the alpha value changes, which means the deeper the color is, the more books from that subcategory is being checked in.
VERSION I:
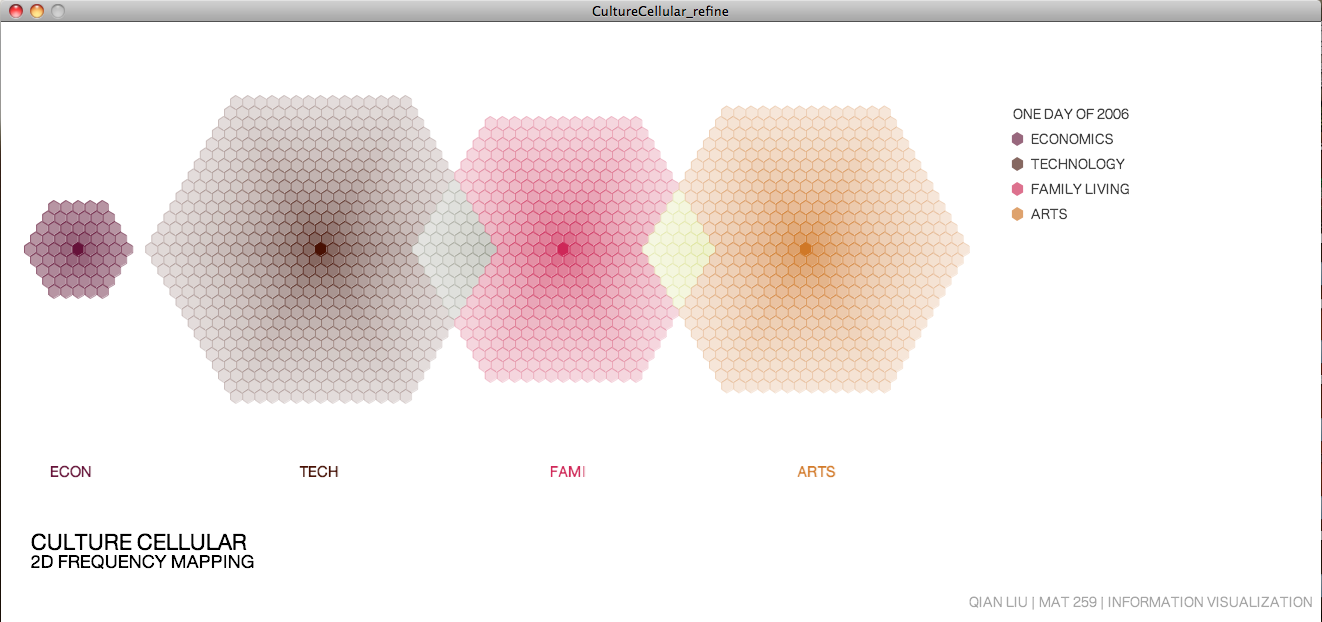
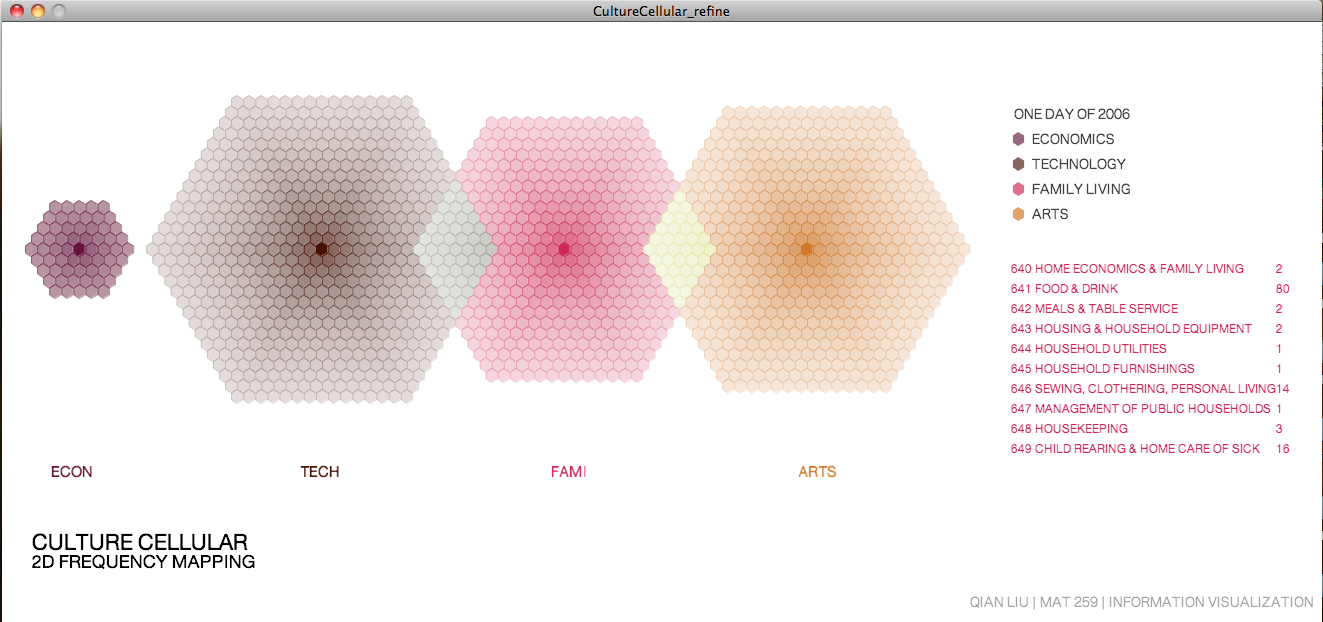
Display with Each Catalog's detail data
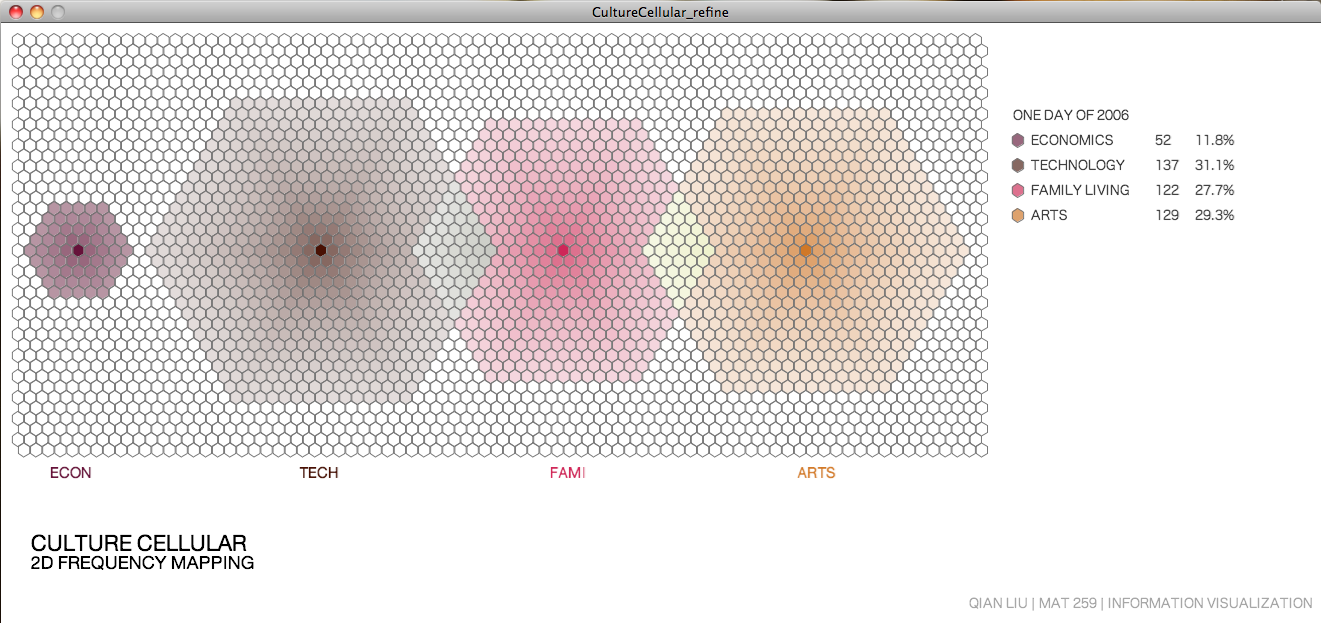
Display with the hexagon grid
VERSION II:
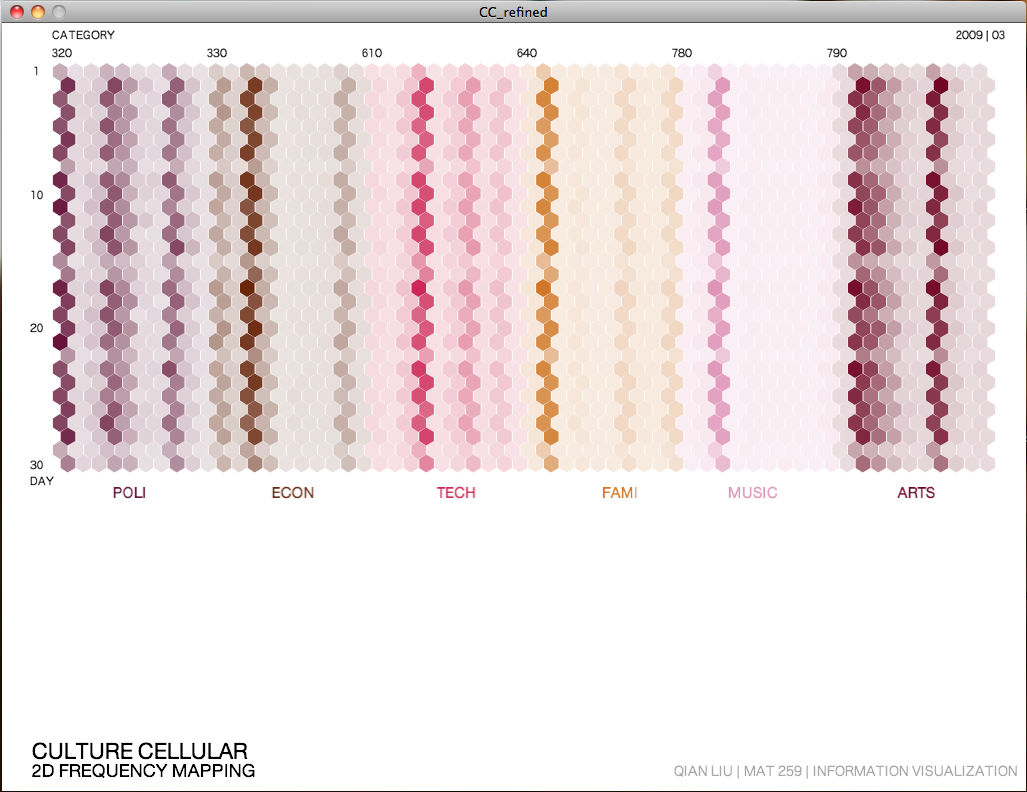
Display with Each Catalog's detail data
Display with category number and book number
UP: show or not show the number and percentage of each category in a daily checked in base(VERSION I)
show or not show the plot details(VERSION II)
DOWN: show or not show the hexagon grid
LEFT: get previous year's data
RIGHT: get next year's data
VERSION I:
Number Keys:
1: Economic Category's detail - subcategory names and checked in numbers
2: Technology(medicial science) Category's detail - subcategory names and checked in numbers
3: Family living's detail - subcategory names and checked in numbers
4: Arts(performing arts) Category's detail - subcategory names and checked in numbers
VERSION II:
1: Political science Category's detail - subcategory names and checked in numbers
2: Economic Category's detail - subcategory names and checked in numbers
3: Technology(medicial science) Category's detail - subcategory names and checked in numbers
4: Family living's detail - subcategory names and checked in numbers
5: Music Category's detail - subcategory names and checked in numbers
6: Arts(performing arts) Category's detail - subcategory names and checked in numbers