MAT 259
Circular Treemap
Qian Liu
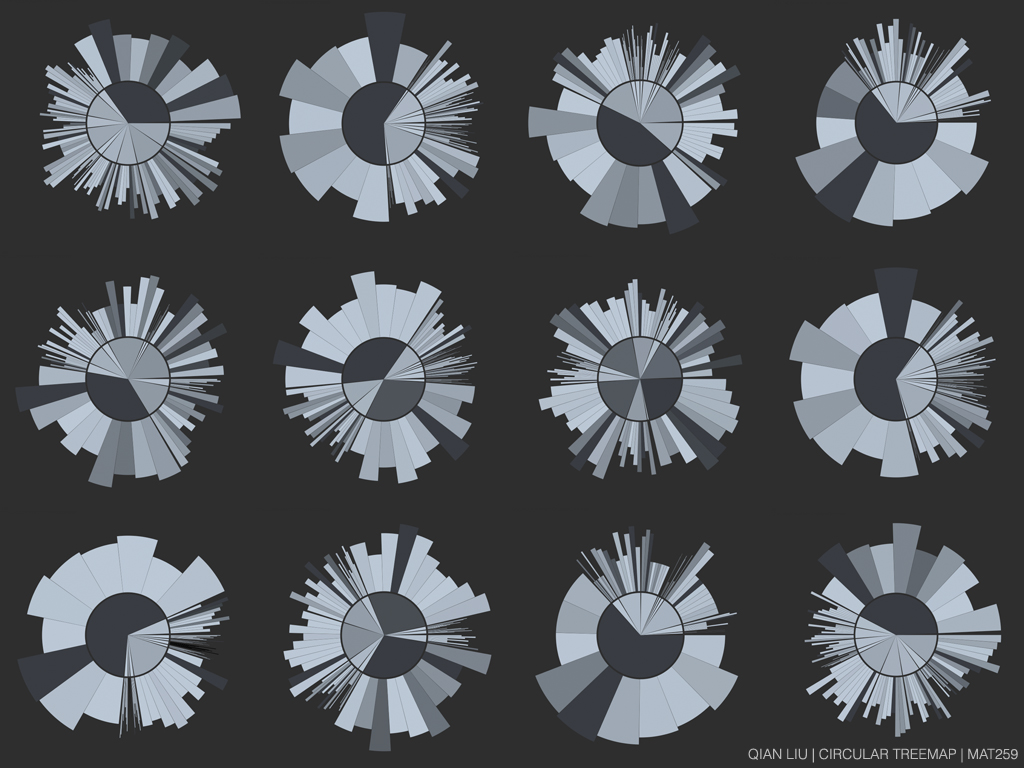
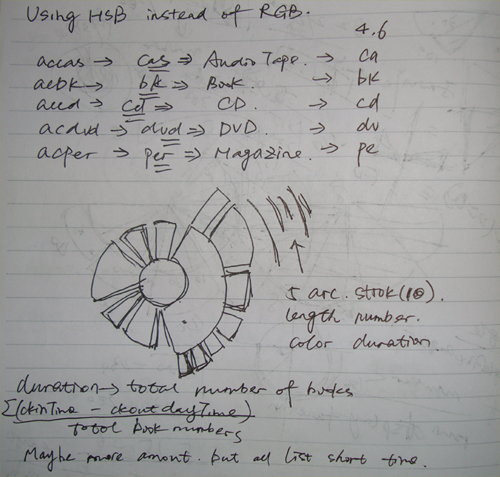
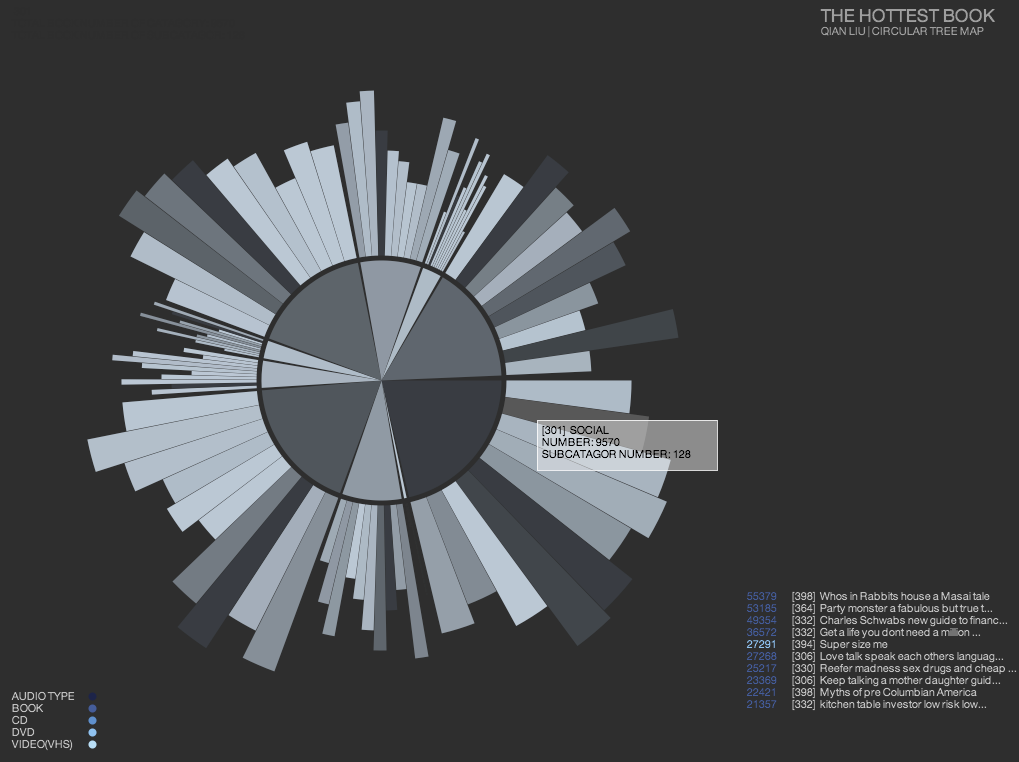
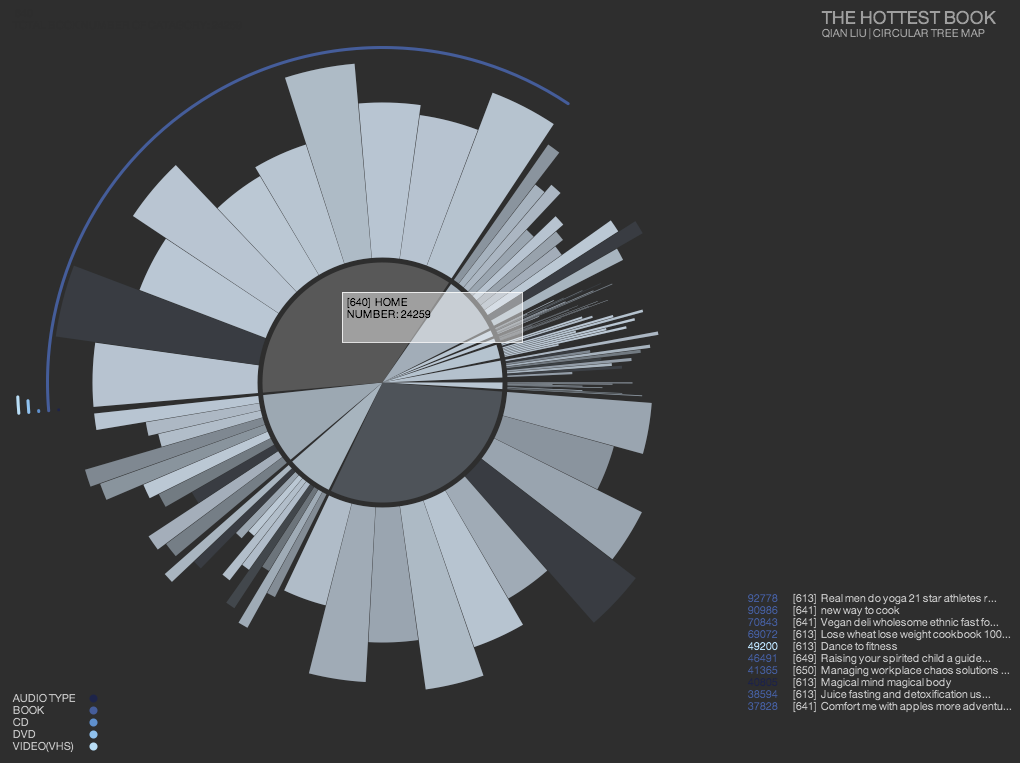
I. The center pie chart: this part represents the total monthly checked-out book amount of each category(000, 100, 200, etc.). Each slice represents the checked-out book amount of that subcategory(010-019, 220-229, etc.). The amount number is mapped to the angle of each slice.
II. The second layer: the shape next to the pie chart, represents a monthly check-out book amount of each sub-sub category(111,234,545, etc.). Each subcategory is made by 10 sub-sub category. As the amount can varies a lot, in order to get a better visuailization, this time, the amount is mapped to the radius of the shapes instead of the angles. For each subcategory, the angle is divided by 10 (as there are 10 sub-sub category). Although the angles are the same, the radius various.
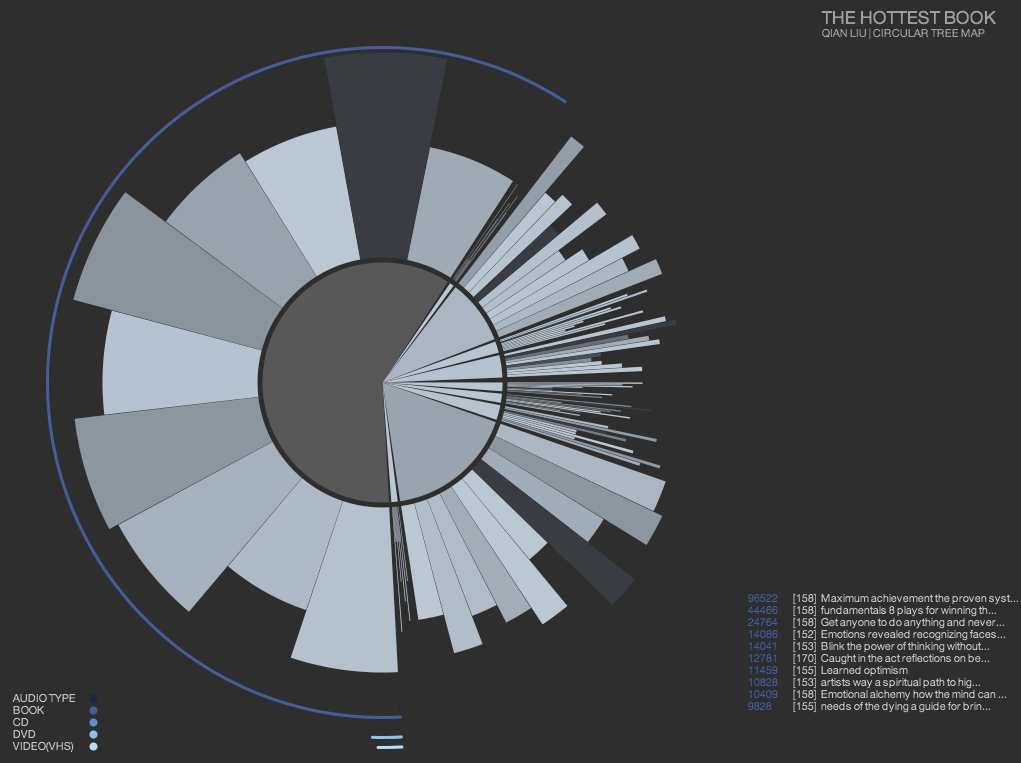
III. The arcs: the arcs around the treemap represents the itemtype of the top 100 popular items in each subcategory. The length of the arcs are mapped to the amount.
Color Mapping:
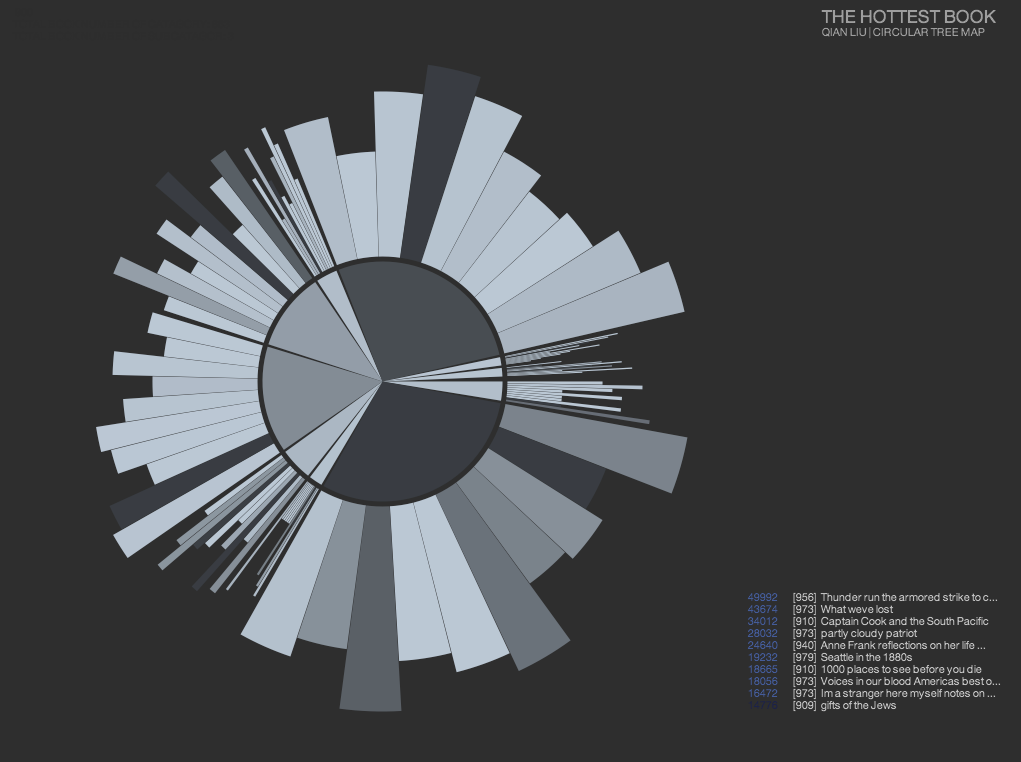
The color also gives different information. For partI, the color means the amount of the books. The deeper the color is, means the larger the amount is. For partII, color represents the hottest book in each category. Circular Treemap compares the top 100 most popular books of each category, and map them to their belonged sub-sub category. If one or more top 100 popular book belongs to one certain sub-sub category, the color of that sub-sub category will get darker and darker and vise versa.
The description on the right hand means: the number being checked out of the top 10 popular books in current category, their sub-sub category numbers and their titles. Different colors of the number means the itemtpyes,which corresponds to the colors of the itemtype arcs.

Plain Treemap
Treemap with Item arcs
Treemap with category details
Display everything
UP: get the data of next category
DOWN: get the data of previous category
LEFT: get previous month's data
RIGHT: get next month's data
Number Keys:
1: Show or not show arcs
2: Show or not show Category details
3: Show or not shhow the book detail on the right