MAT 259 - 2011W
Patrick Rudolph | Hot Topic Evolution 2006-2010
Description
The third project goes back to the idea of my first one involving plots. I again chose five topics ("Global Warming", "Obama", "National Parks", "Soccer" and "Bush") and represent the number of their checkouts in relation to each other. In contrast to the first project, I focused on showing a trend (e.g. checkouts during the last 30 days) instead of showing the whole picture. Still, the data runs through 5 years (2006 to 2010) and there is also a small chart to see the evolution over the total duration. A second layer of data explores the distribution of dewey categories within each topic. In addition to that, I tried to find a way to represent every single checkout, which has been realised as small "explosions". Furthermore, there are possibilities of interaction, like adjusting the speed of the animation as well as the period of trend and choosing specific days.
The data from project #1 has been further improved in order to represent every single checkout and dewey classes. I also excluded items that have been checked more than once for one checkout. I obtained the data previously and saved it to files which are then loaded at program execution. Those data files can be found within the data folder of the source code.
This project was realized using Processing.
Project Evolution
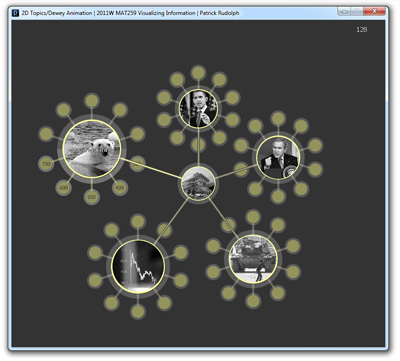
First version with little functionality and some design ideas.
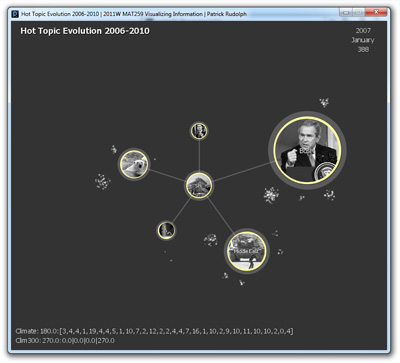
Second version still without an overview over the complete data in the end.
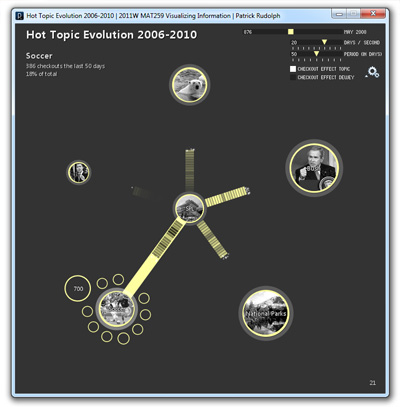
Final visualization with overview in the end (bars that move from the center to the topics), increased functionality and style tweaks.
Source code: Project3 Checkout Circle Item Level1 Level2 Misc