MAT 259 - 2011W
Sandeep Bhat | Project 3 | 3D Spatialization & Animation
Dewey Classes, First Letters and Transactions
Description
This project is an extension of my first project, and attempts to study the number of transactions as a function of both the dewey classes and the first letters of item titles. Unlike my first project which studied this relation ship at a corse time scale of years, this project attempts to study it at a finer time scale of months and incorporates 3D spatialization and animation to achieve this goal. The key differences from my first project are highlighted in the following sections.
The project was realized using Processing and its OpenGL libraries on Mac OS X. The code development and debugging were accomplised using Eclipse IDE. The ControlP5 library provided the framework for the multiple control windows used and the PeasyCam library provided the tools needed for interaction with the 3D environment. The visualization is based on the data got from the spl_all database hosted on tango.mat.ucsb.edu. This database contains information about all the transactions in the Seattle Public Library done between 2005 and 2010. For this project only the deweyClass and title fields are being considered. Due to the memory and processing requirements, only the months between 2008 Jan to 2010 Dec are visualized here.
Quick Links
Applet | Source Code | Main Menu | Transactions-2D | Transactions-3D | Transactions Animation |
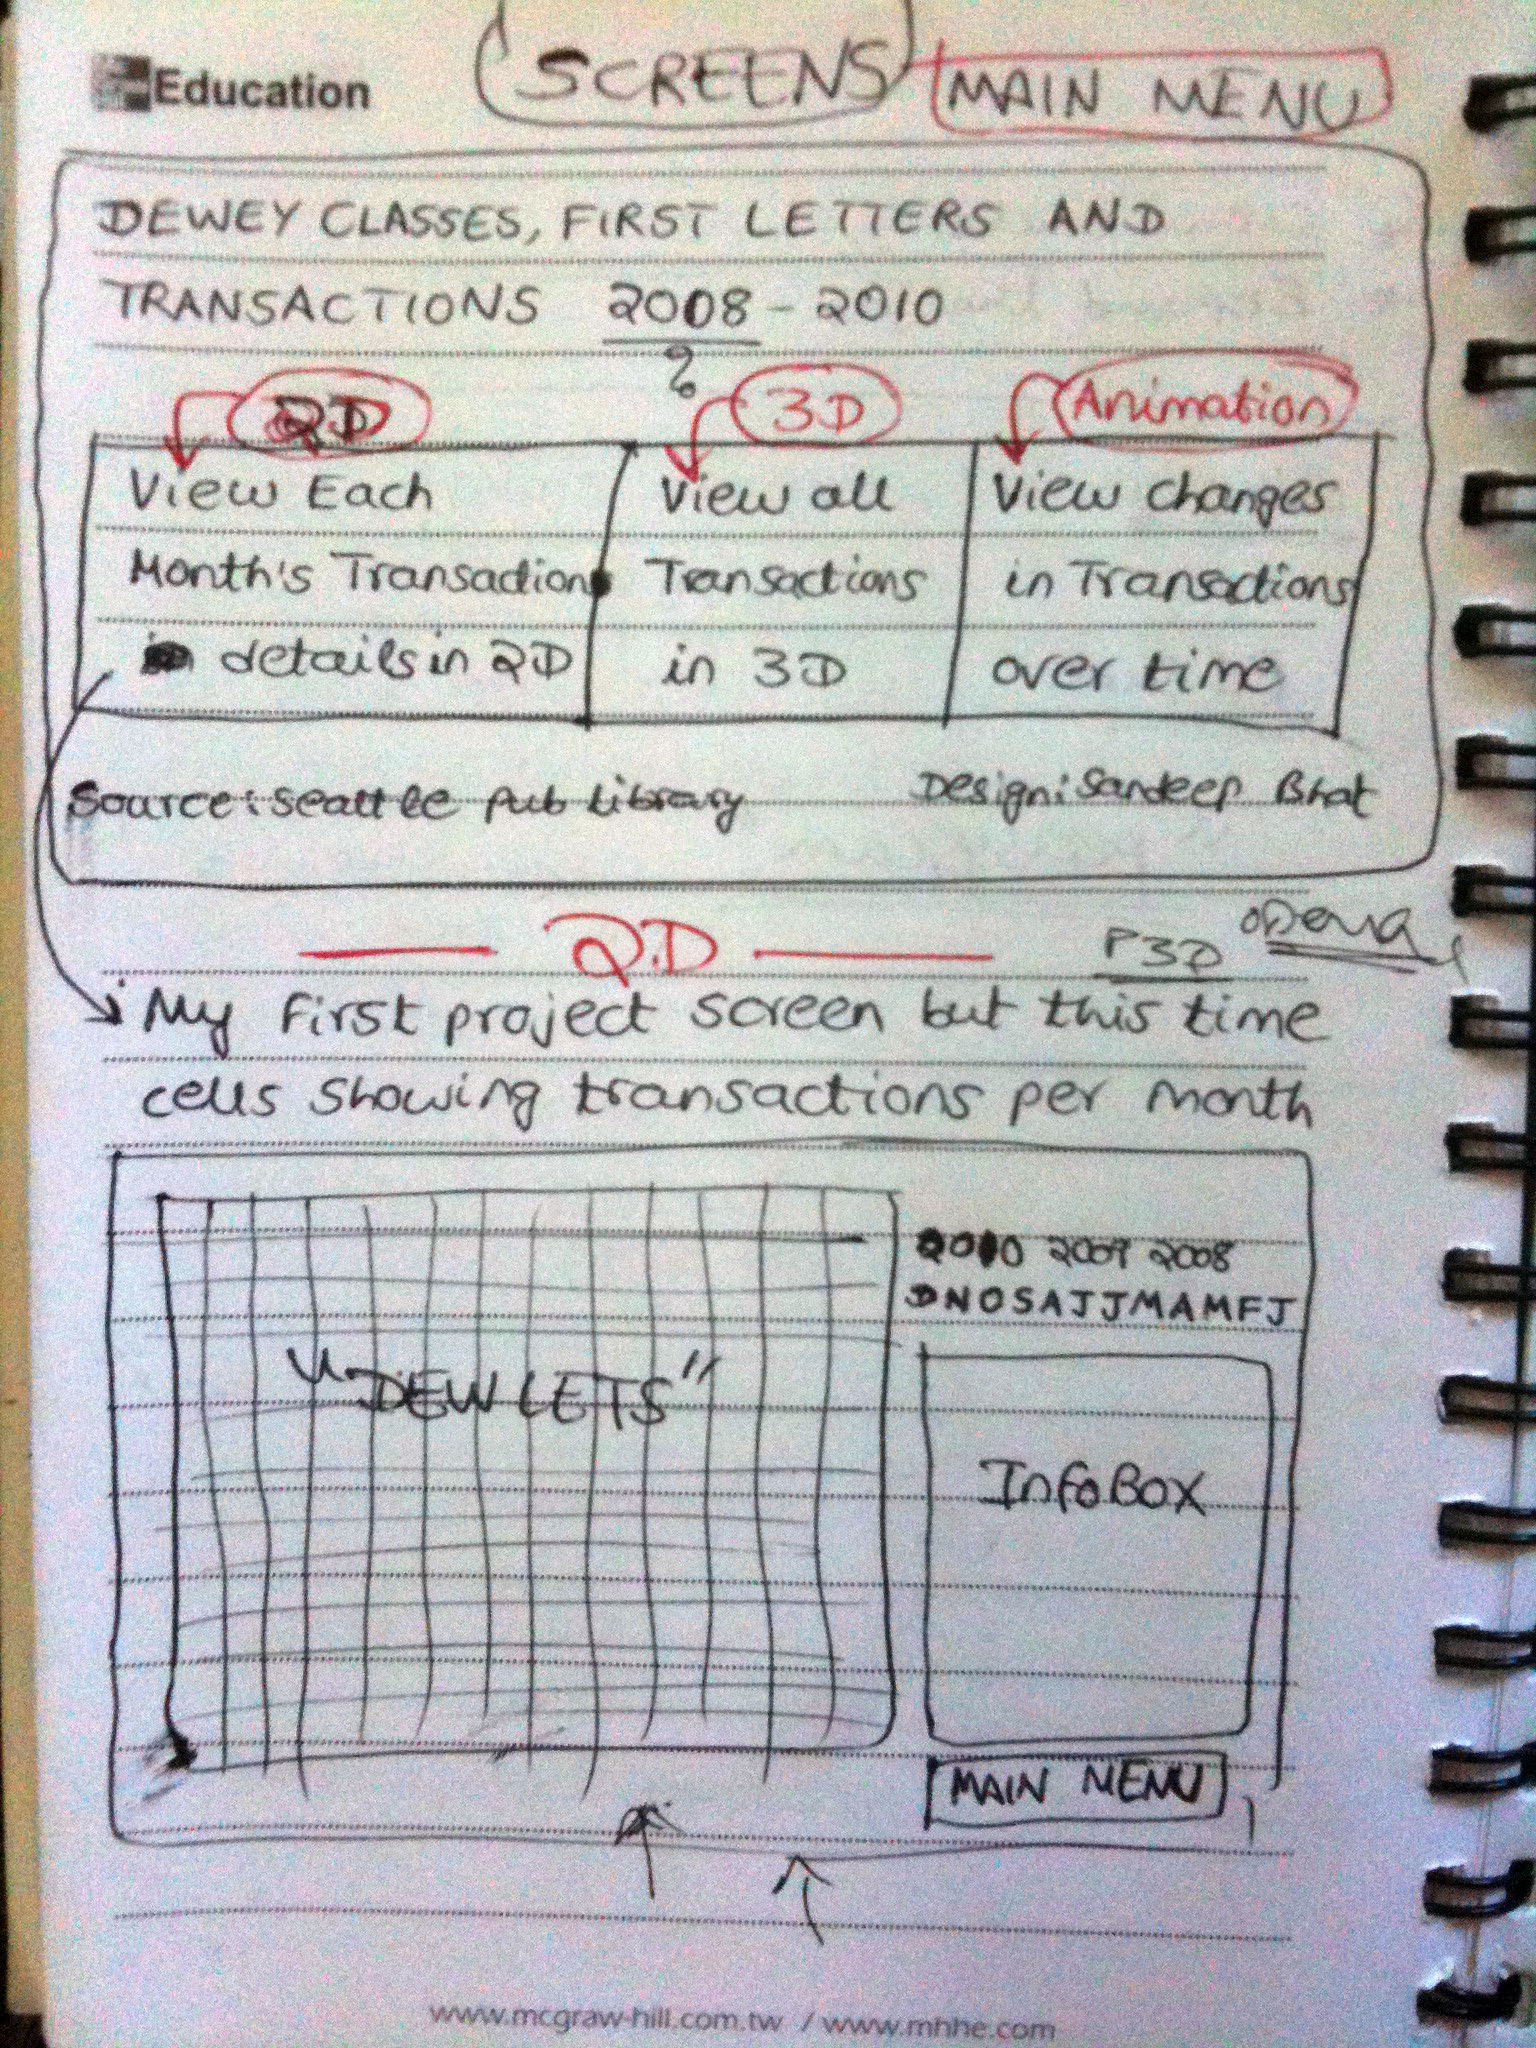
Initial Doodle
Initial doodle of the visualization showing the 4 screens: Main Menu, Transaction 2D (first project), Transaction 3D and Trsactions Animation.
 |
 |
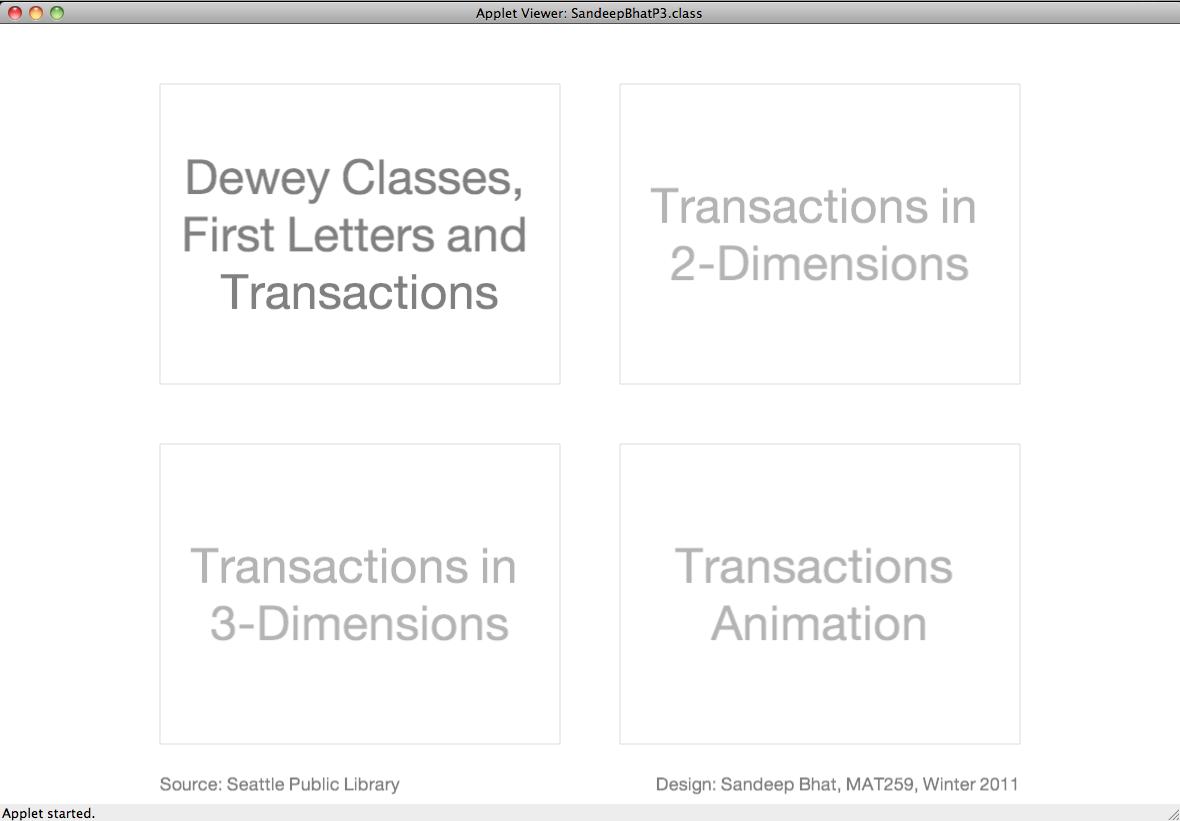
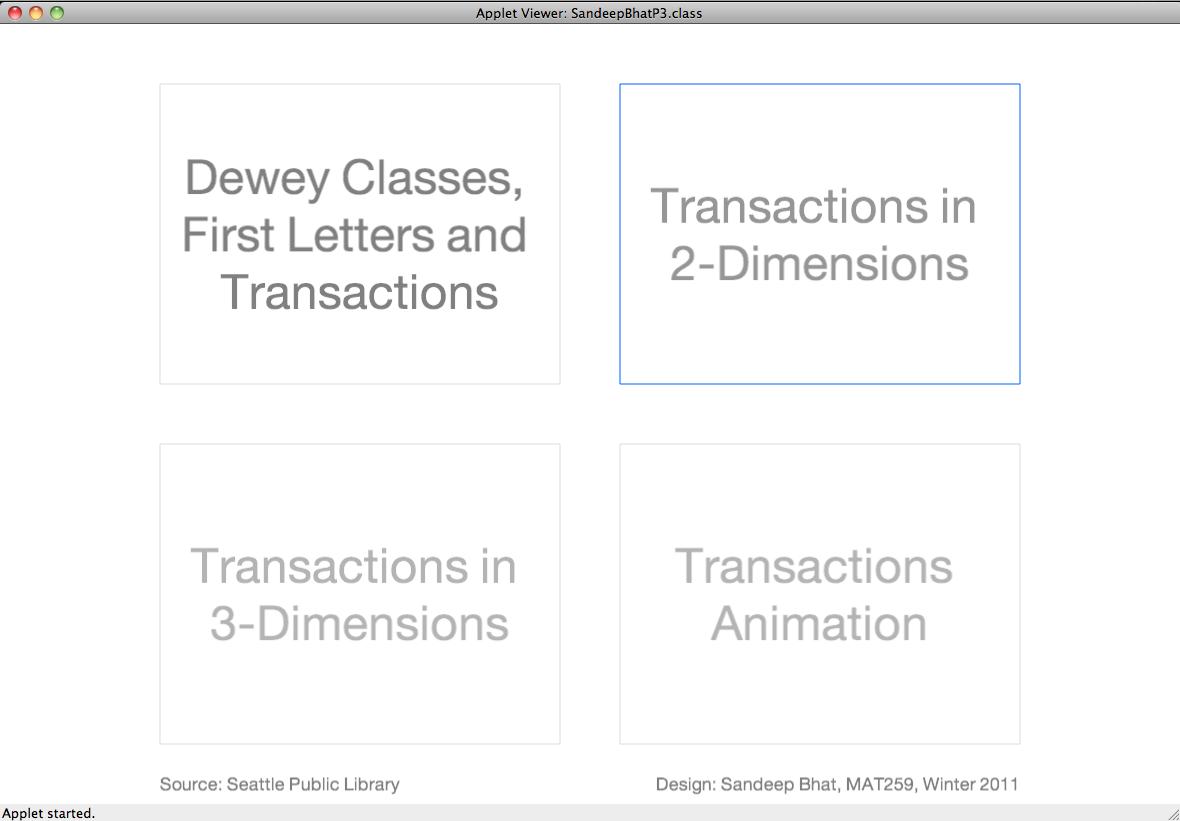
The Main Menu screen is like a gateway to the 3 different visualization types available in this project. The Main Menu has 3 large buttons that the user can click on to get to other screens in the project. Hovering over a button highlights it with a blue box as shown in the image below. When the user presses the Top button in any of the other screens control comes back to this Main Menu. The user can jump from any screen to any screen by pressing number keys 1 (2D), 2 (3D) or 3 (3D animation). This way the user need not come to the Main Menu everytime between screens.
 |
 |
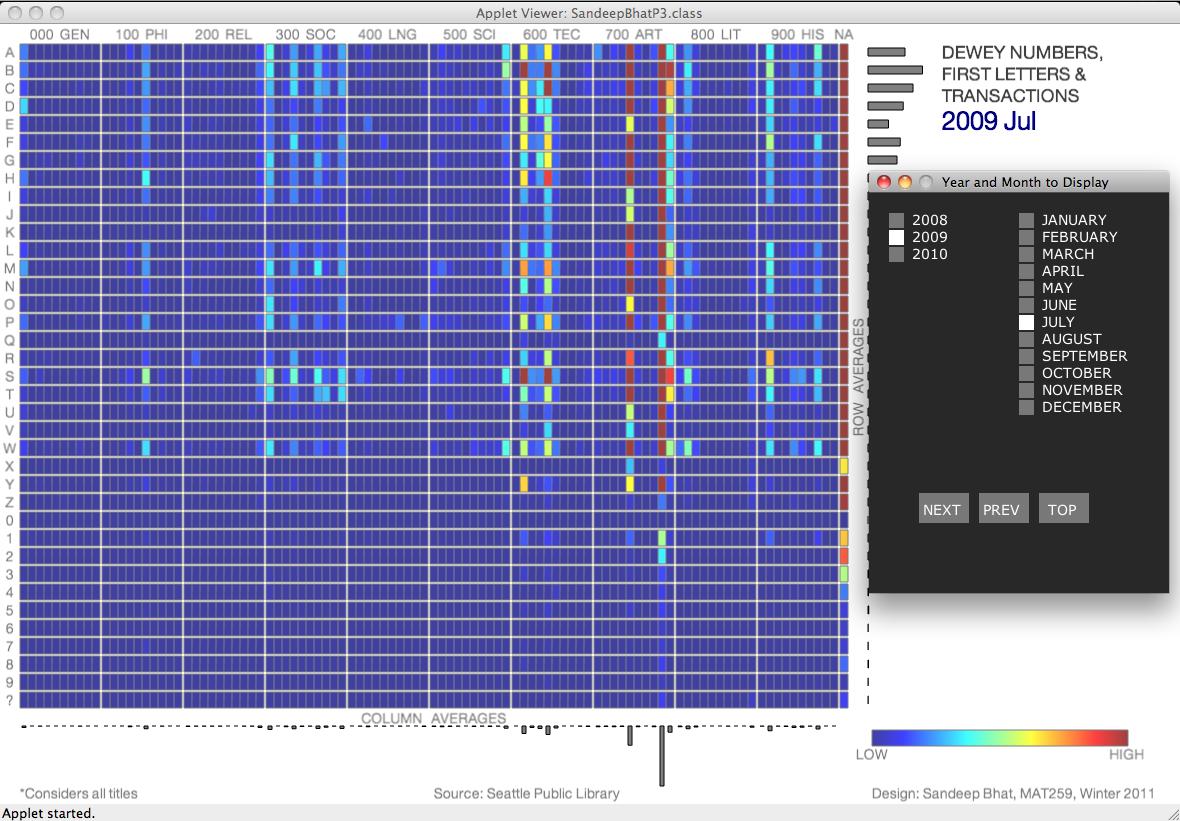
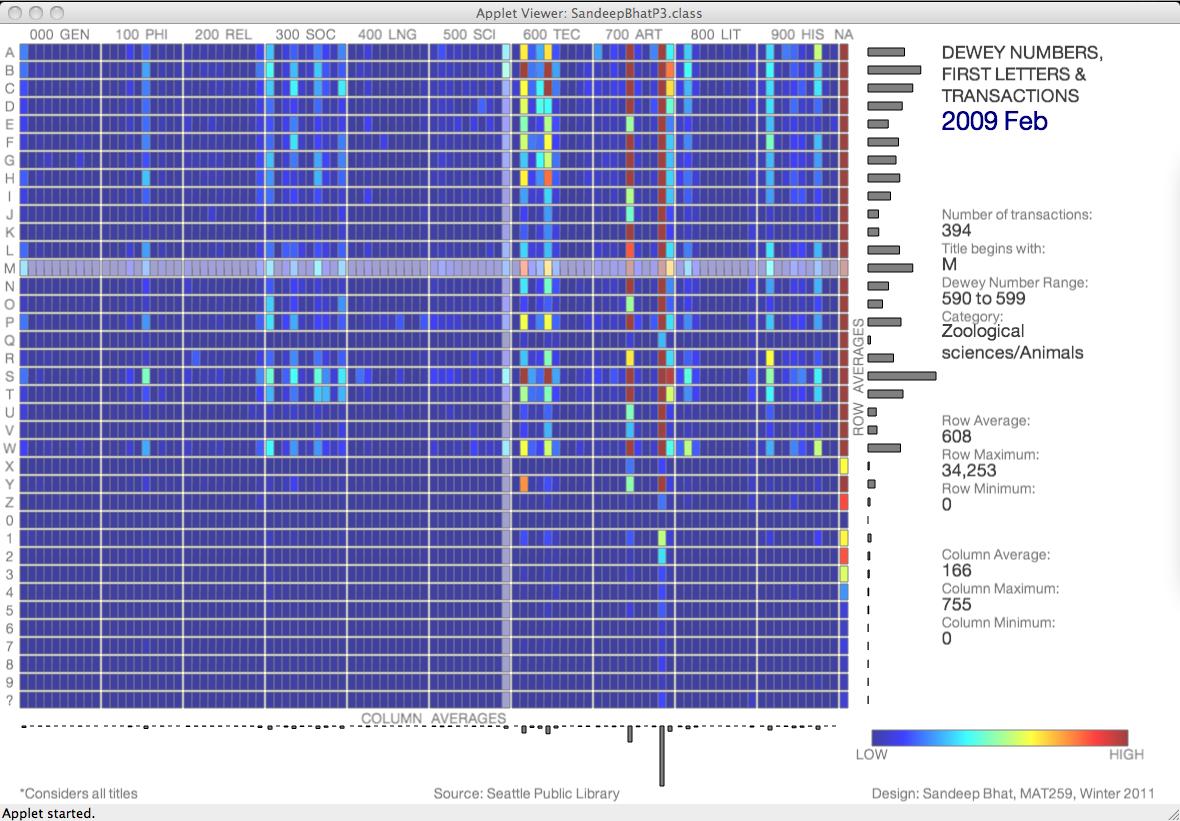
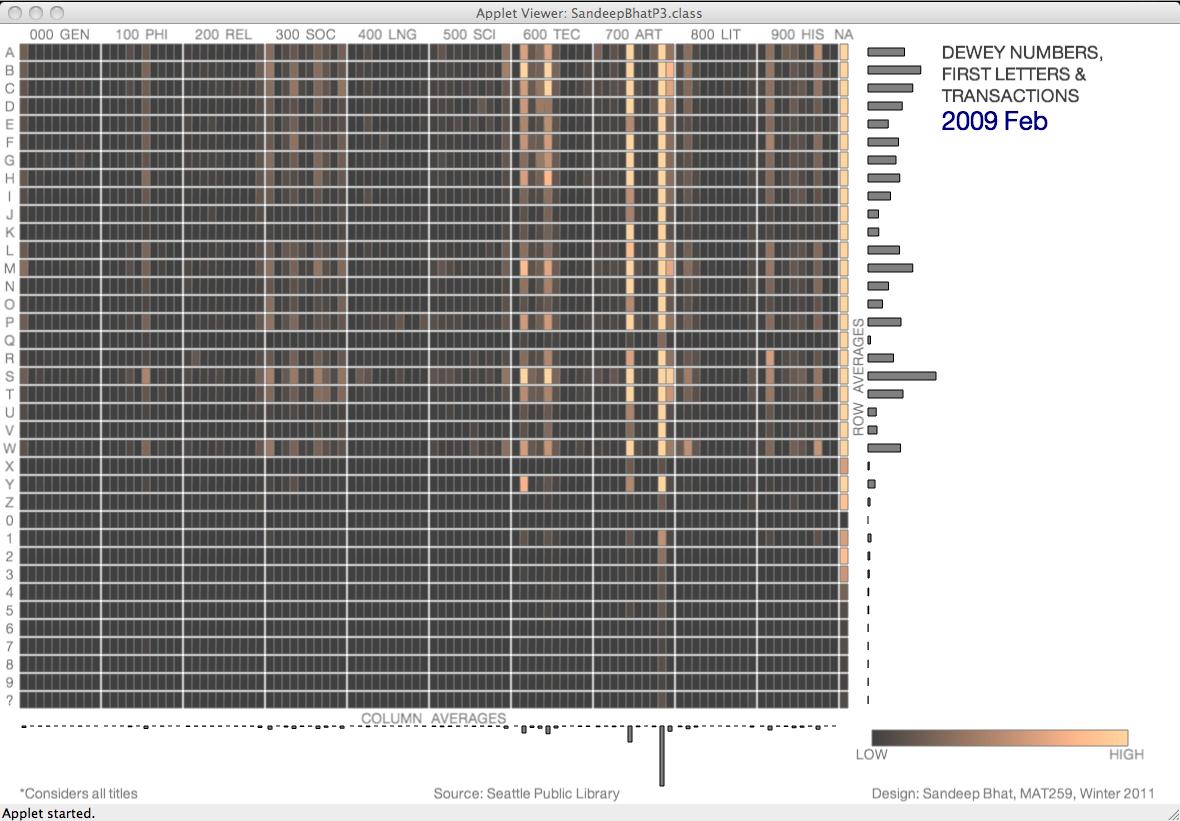
When the user clicks on the button Transaction in 2D-dimensions in the Main Menu, it brings a "3D-plot", showing the Dewey classes along X-axis, the first letters of item titles along Y-axis and the number of trasactions as a colored cell or DewLet. This part is identical in the visualization to my first project and supports the same features. The key differences are, the time scale is finer (months) and there is now a controller that allows the user to jump back and forth between any two chosen months. The controller can be called on demand by pressing the "." (dot or period) key. The user can choose the month and/or the year by selecting the radio buttons using the mouse. Pressing on the Prev or Next button will take the user to the previous or Next time point respectively. Hovering over a DewLet brings the crosshairs for easy navigation and also shows the information pertaining to that cell in the Info Box. The Average transactions for a particular row/column are used to plot the row and column bar graphs.
 |
 |
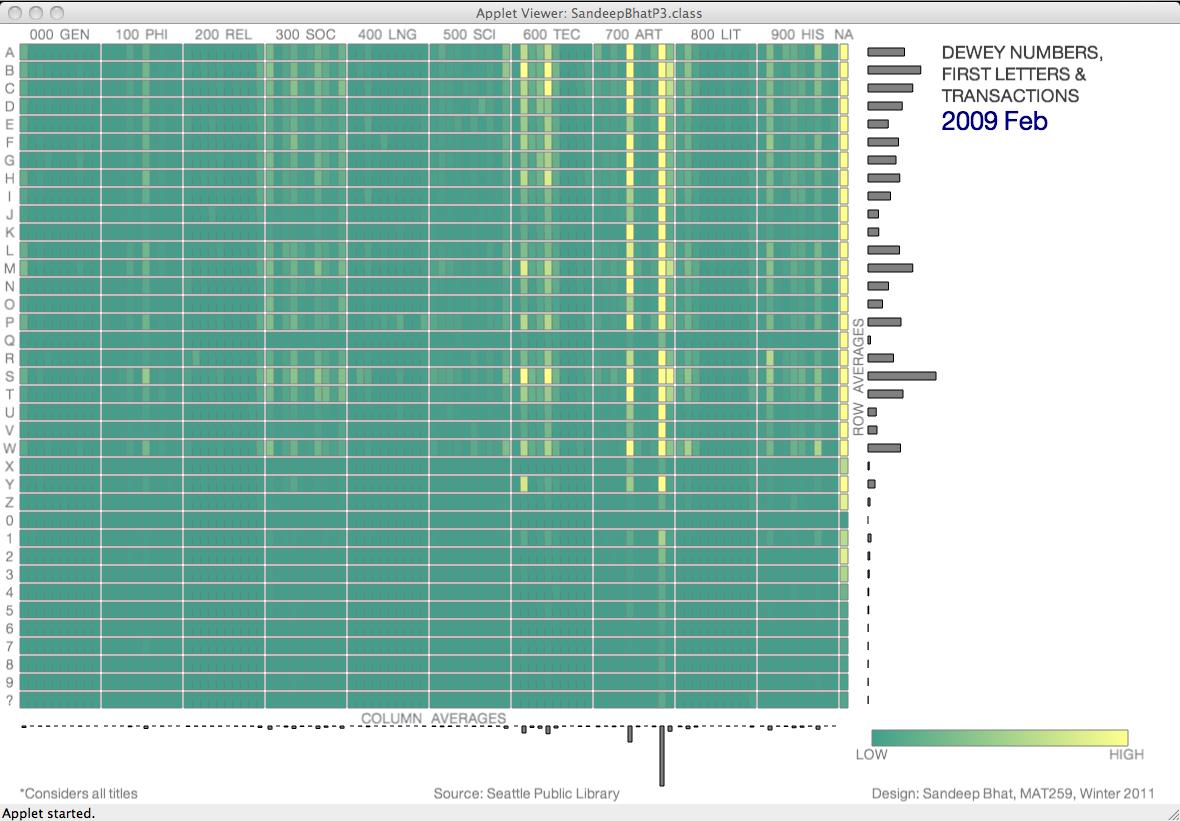
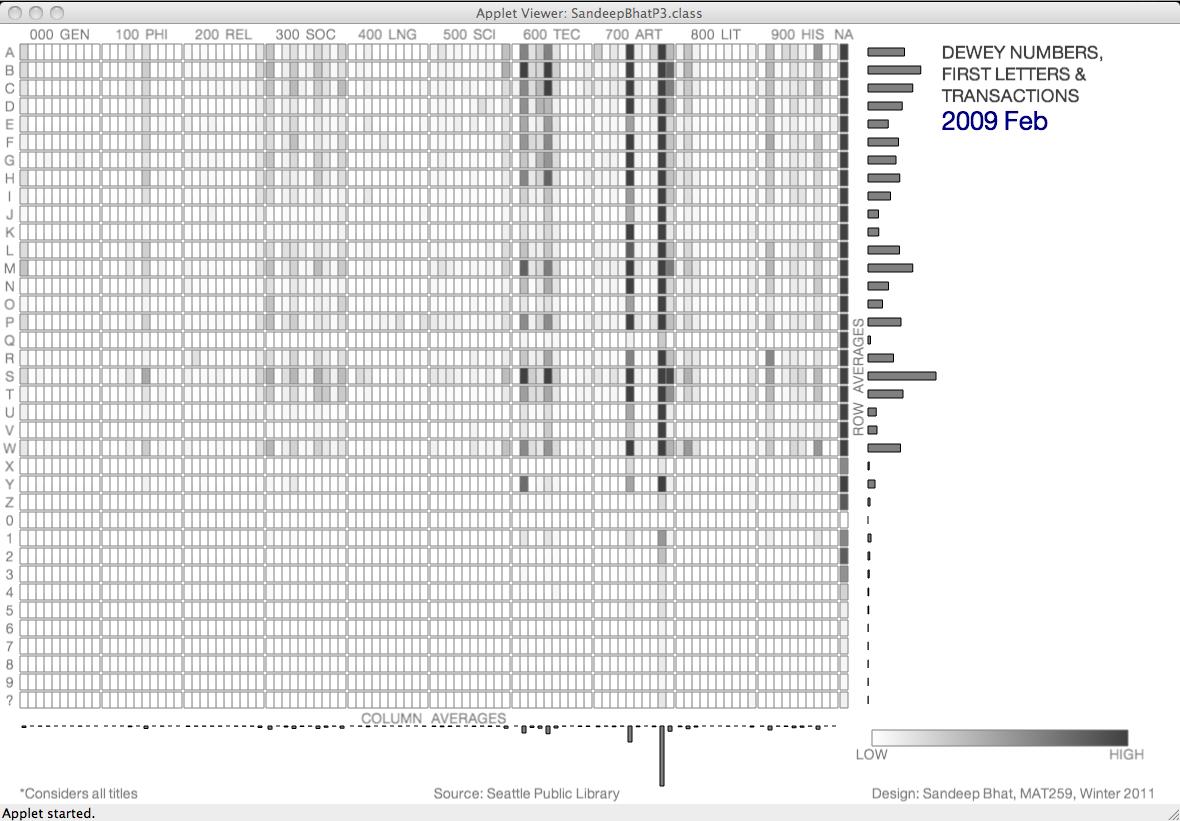
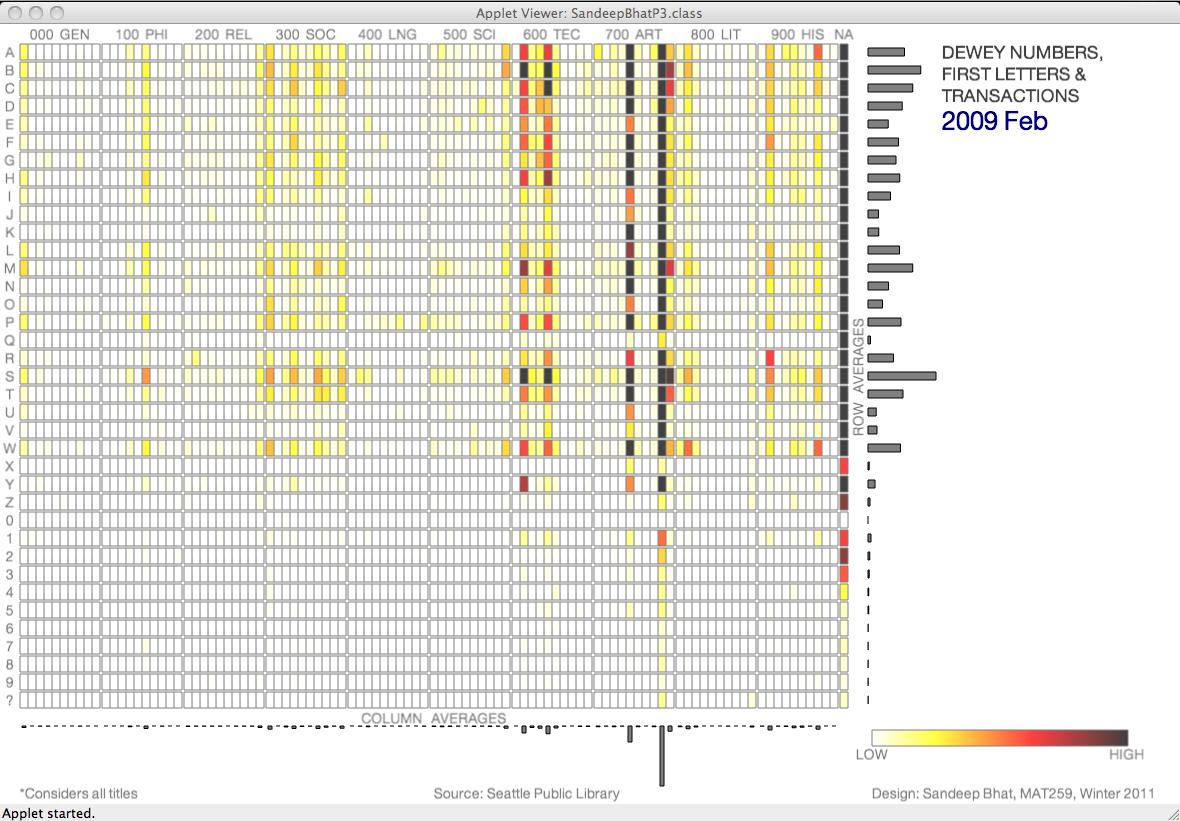
The user can Press "D" key to cycle through the datasets: All titles, Hate Titles only and Love titles only. The user can press the "C" key to cycle through the colormaps: Flow, Summer, Copper, Gray and Hot. The first 3 colormaps use saturated colors for both low and high trasactions, where as the last two colormaps use unsaturated colors for low transactions and saturated colors for high trasactions.
 |
 |
 |
 |
Pressing the Top button on the controller takes the user
back to the Main Menu.
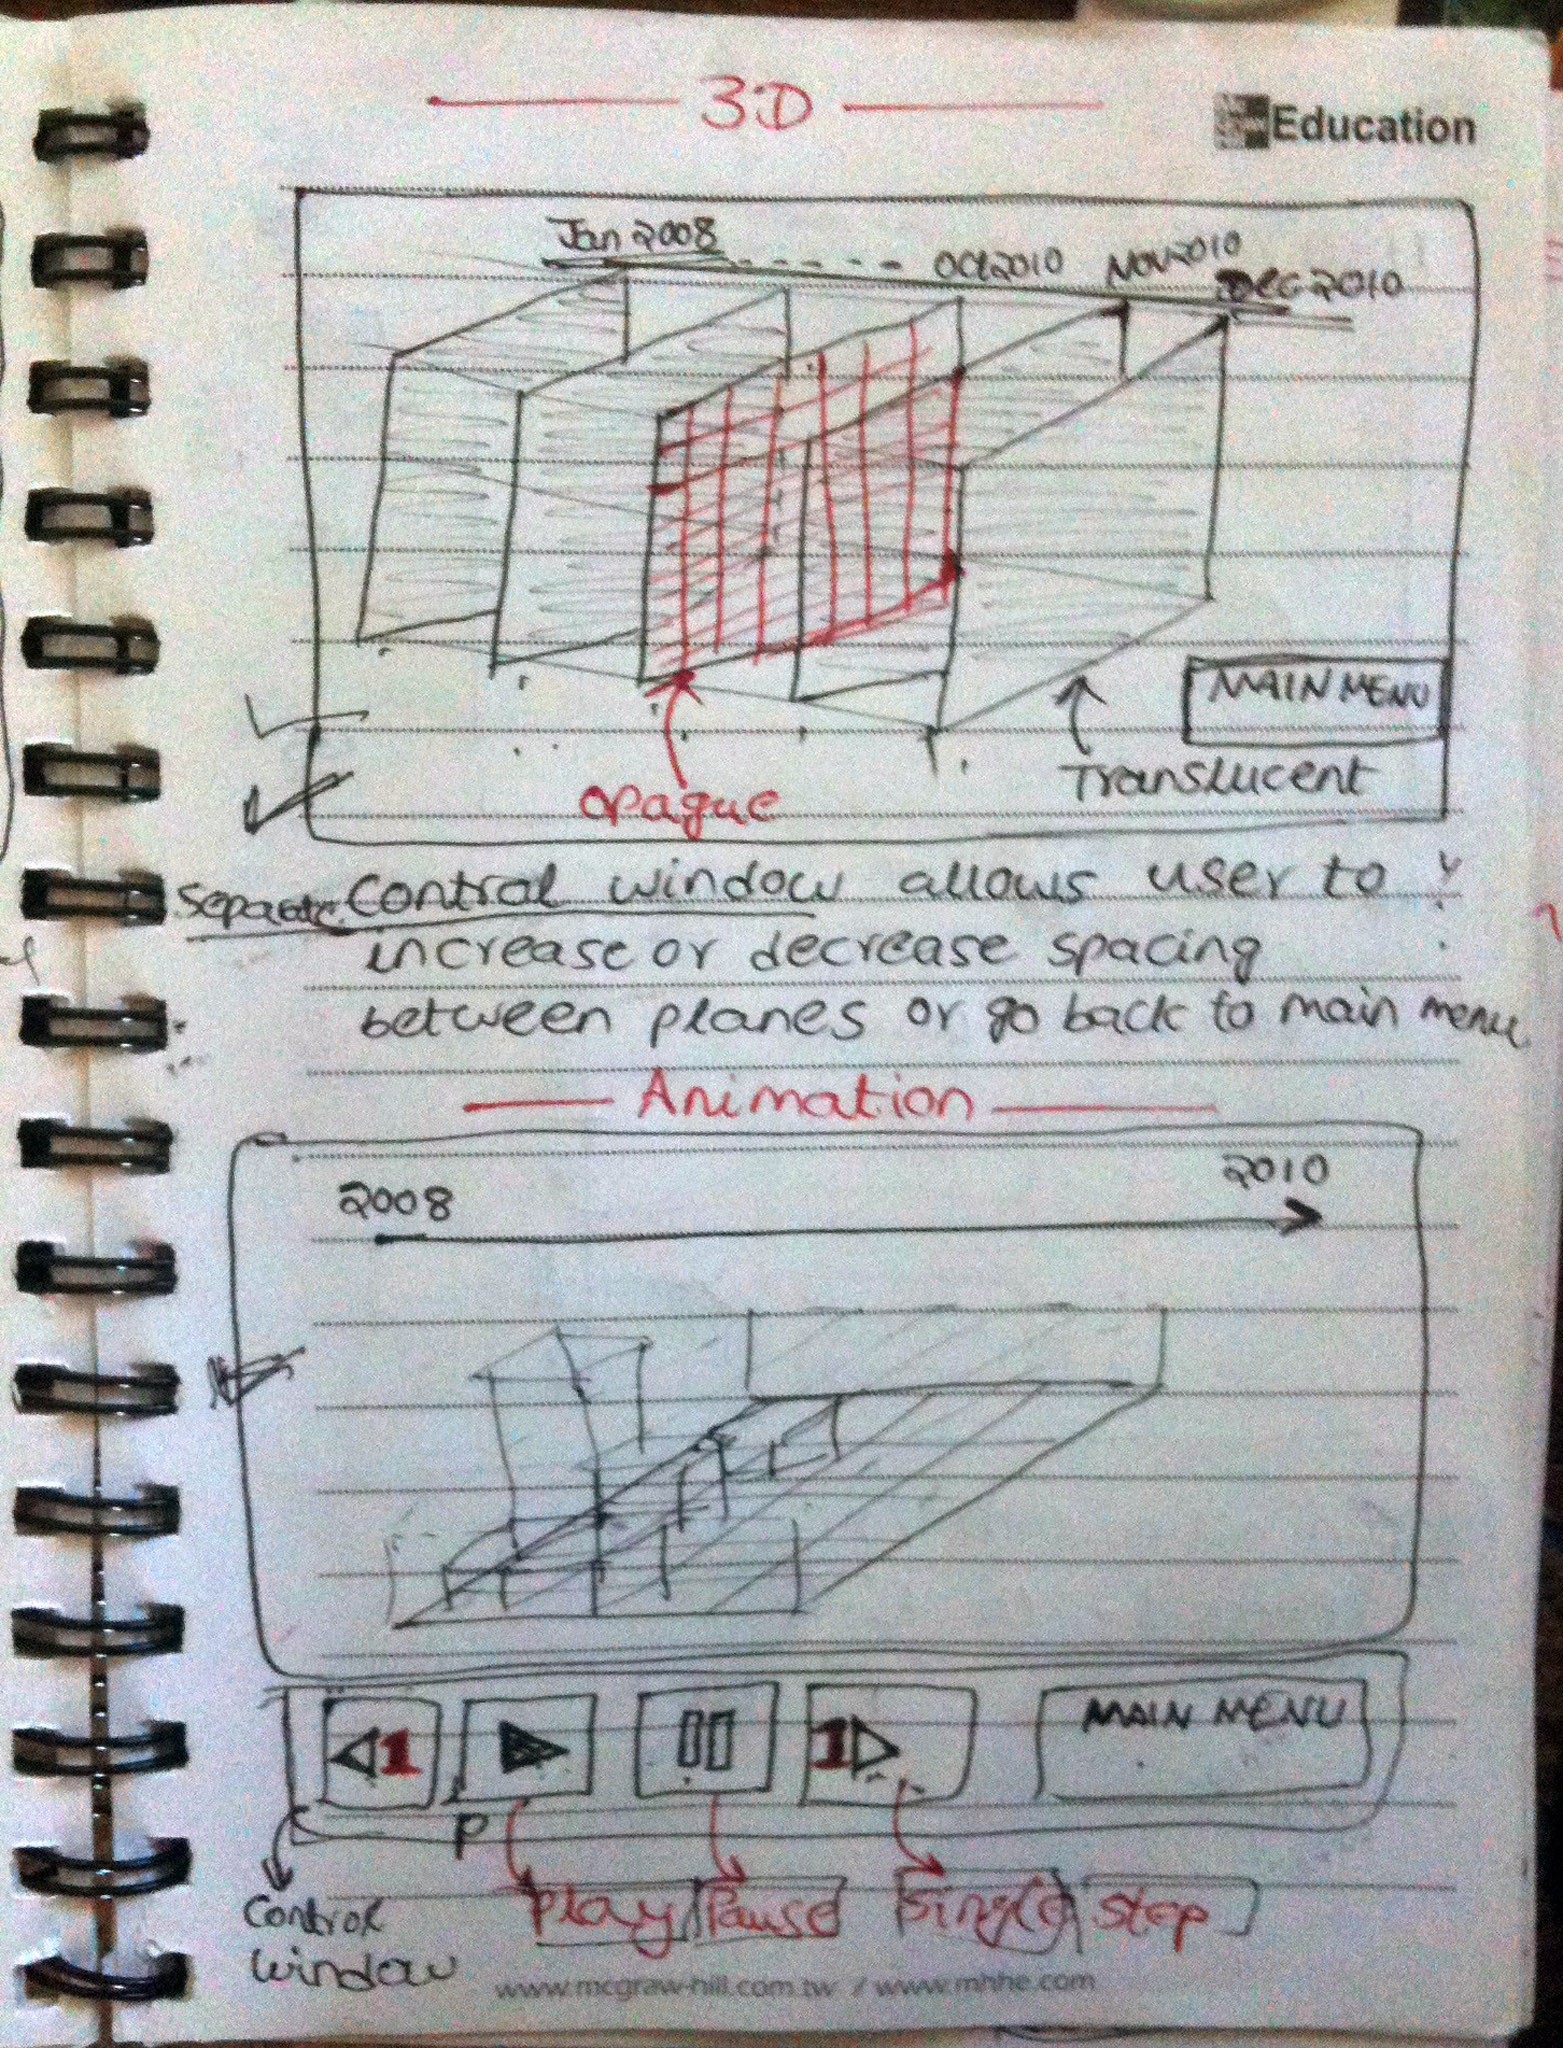
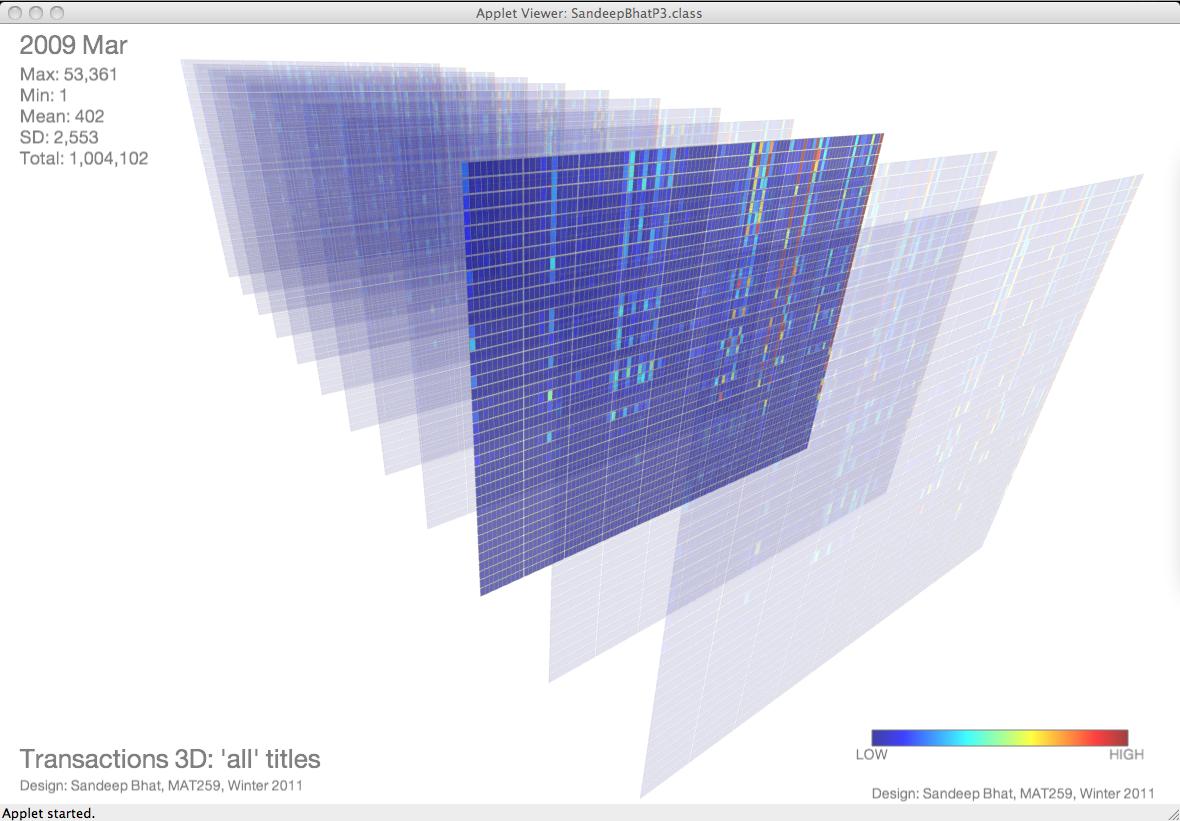
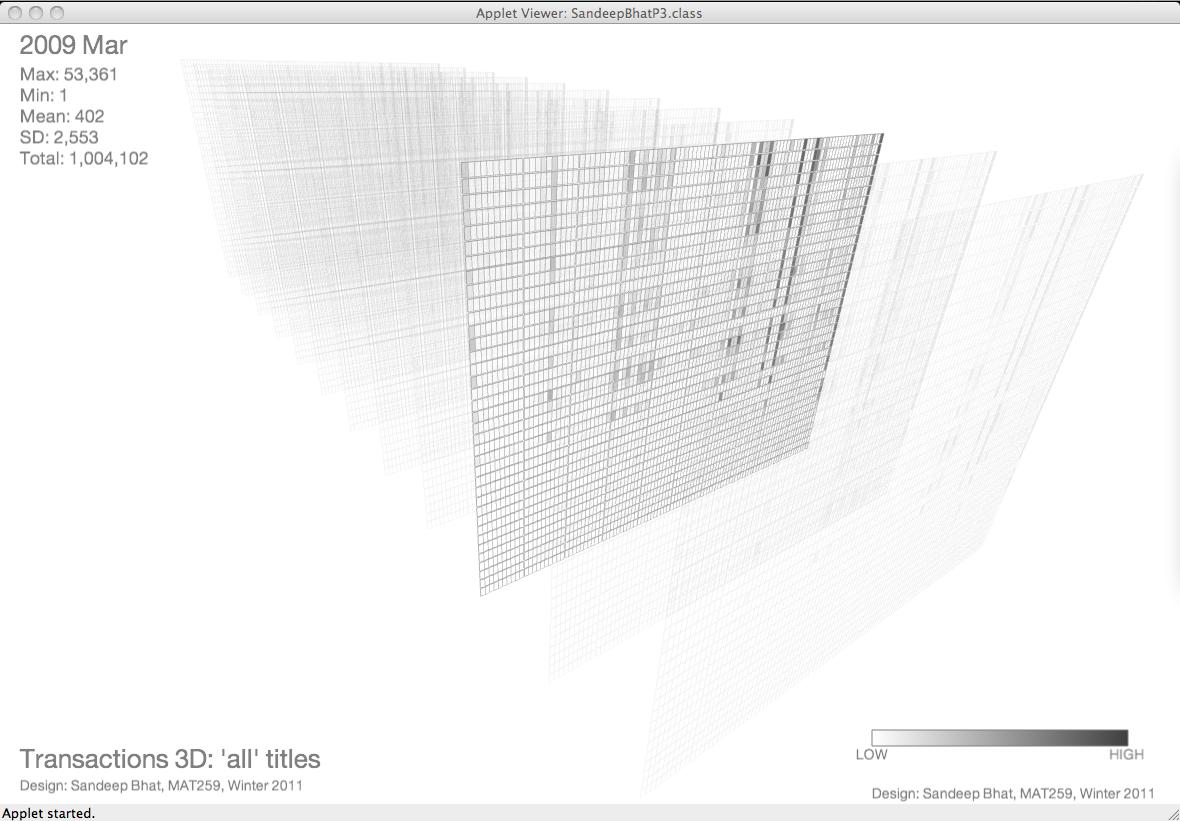
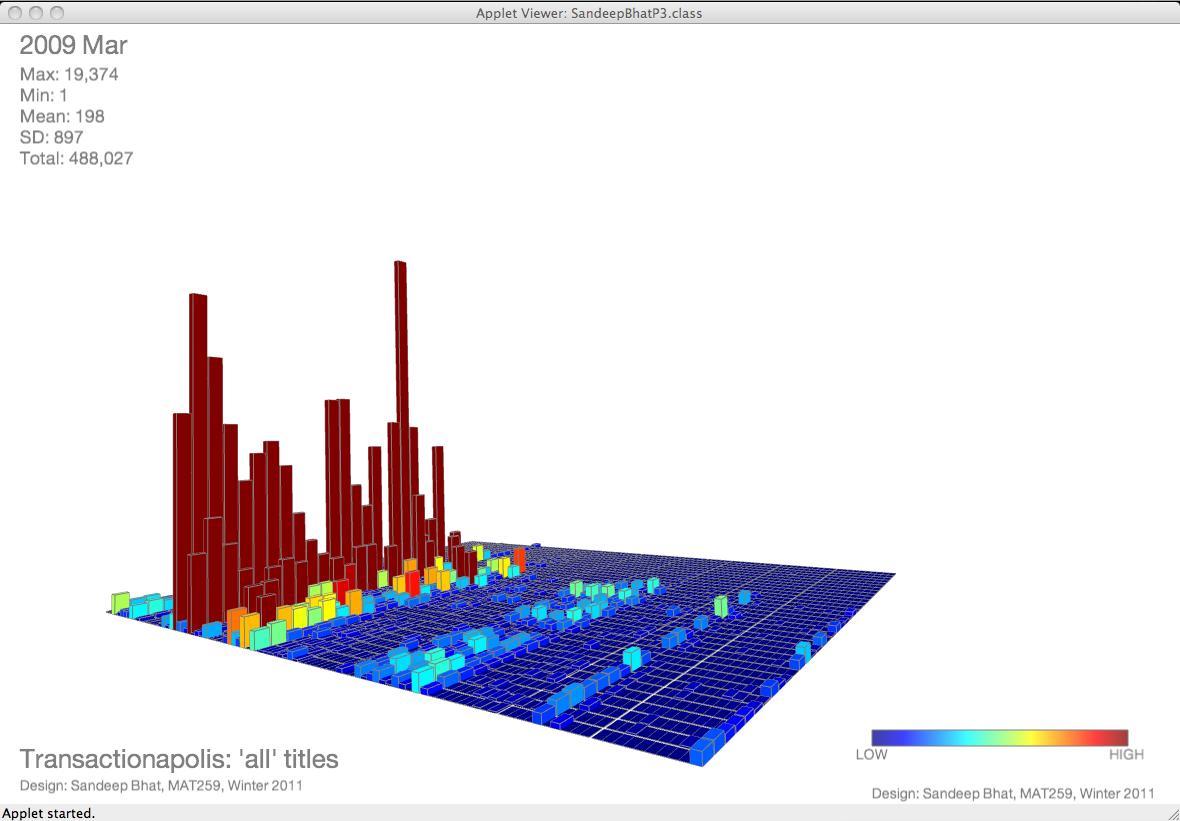
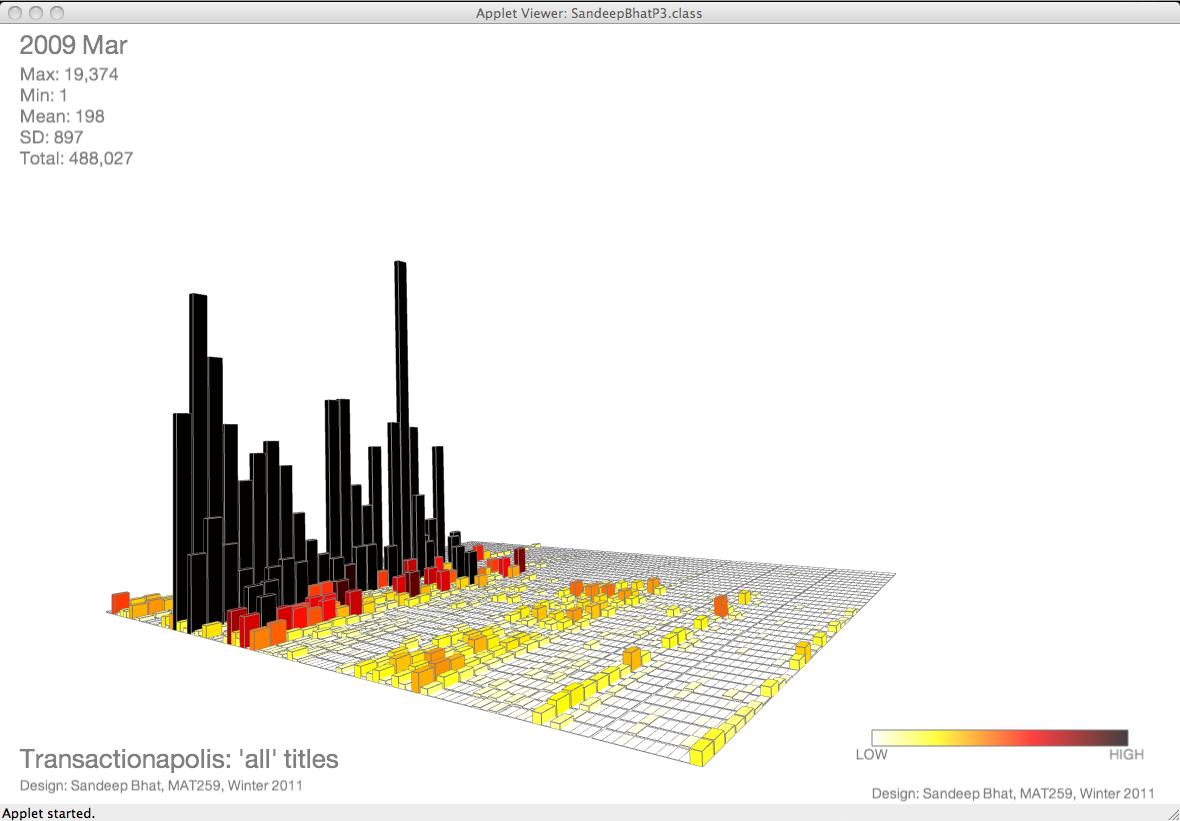
When the user clicks on the "Transactions in 3D-dimensions" button, they are presented with this screen. The screen has an array of "3D-plots" with X-axis being Dewey Classes, Y-Axis the first letters and Z-axis being time points (months in a particular year). The number of transactions are still represented using colored cells. The user can change the colormap by pressing the "C" key. Gray and Hot colormaps are better suited for this visualization. An immovable information box at the top-left shows the transaction statistics for the selected month.
 |
 |
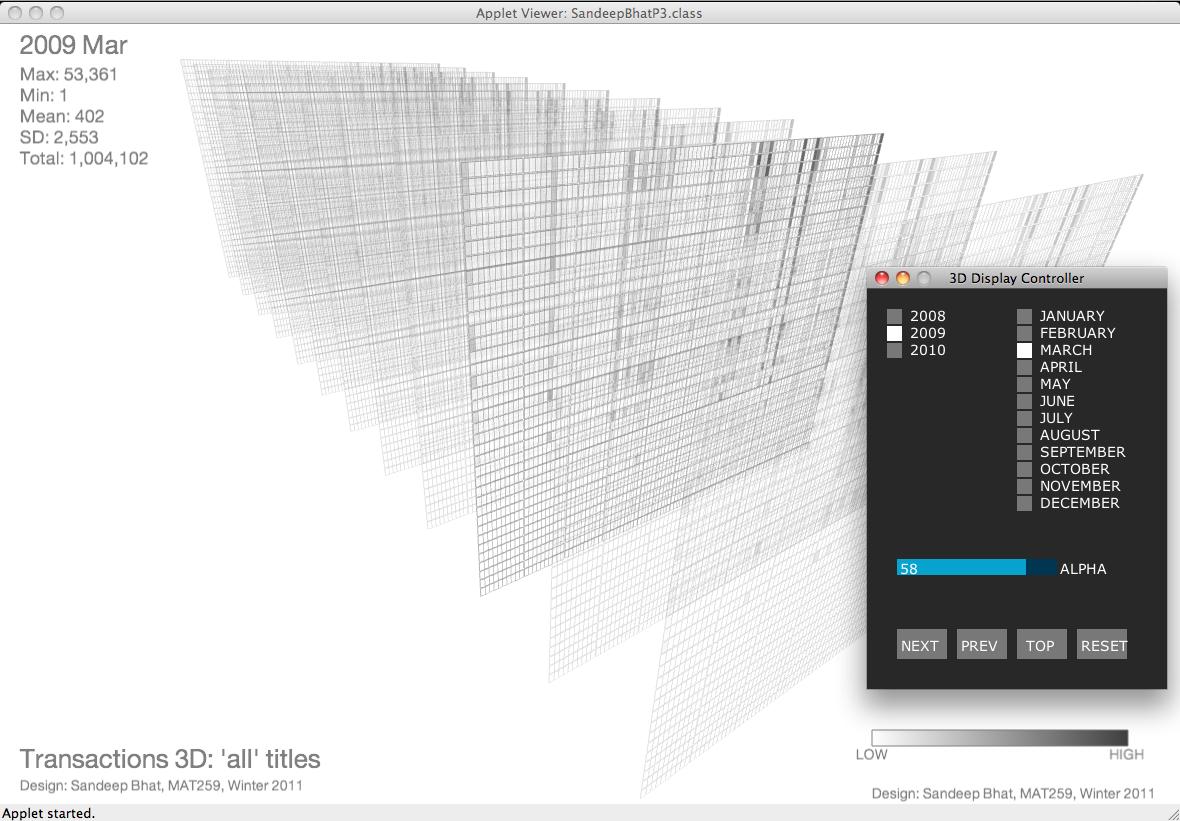
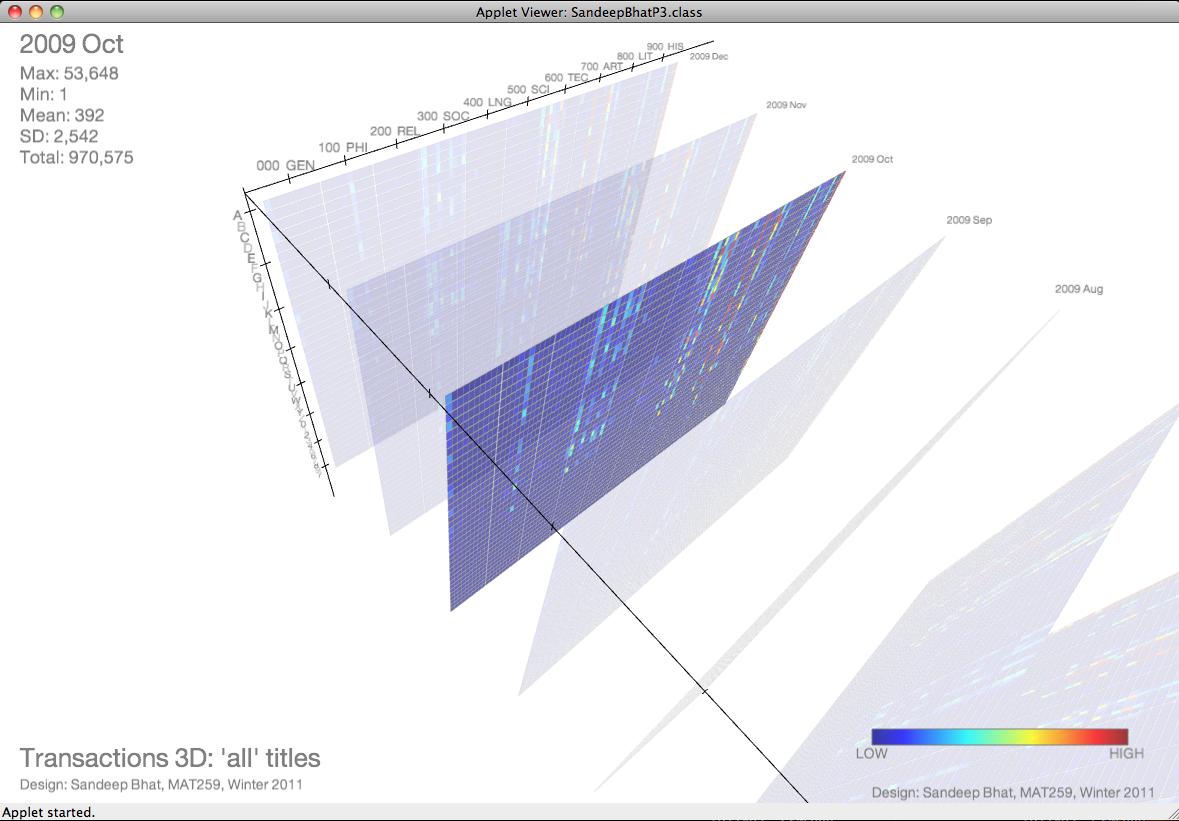
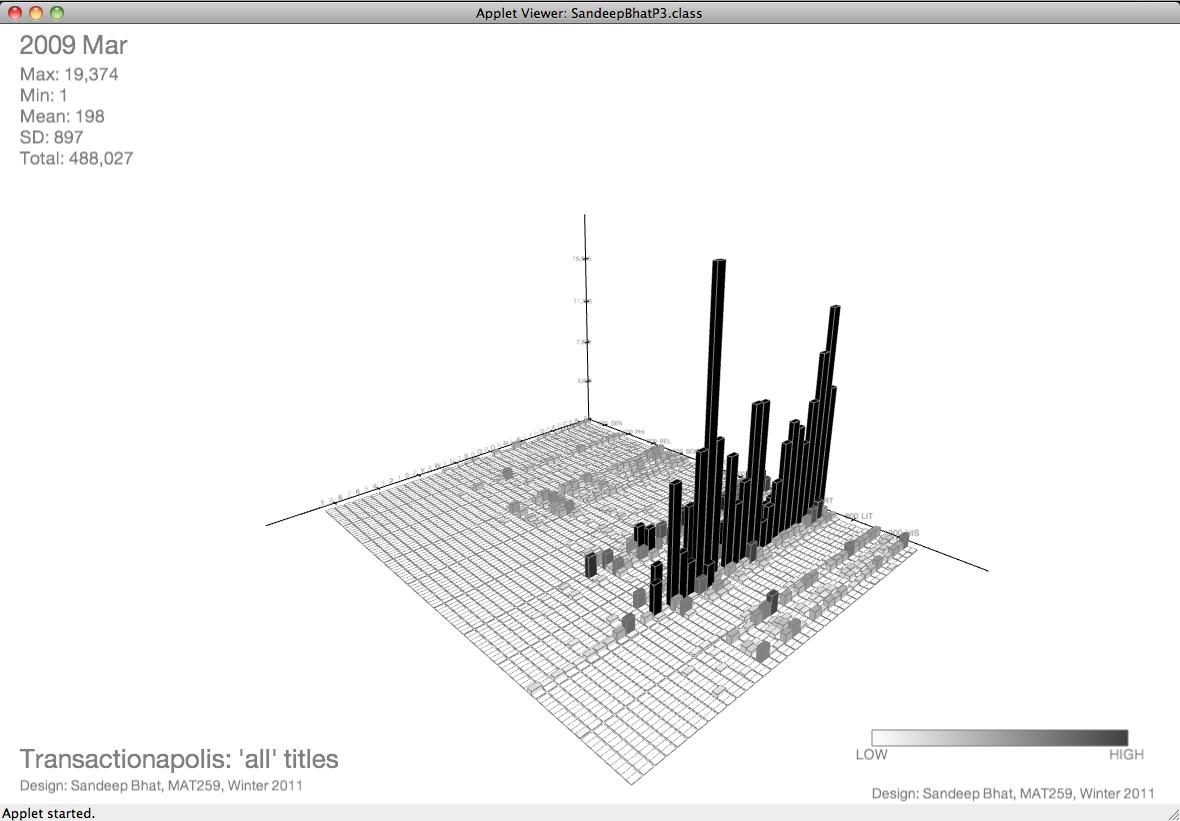
The user can bring up the controller for this screen by pressing the "." button. The controller allows the user to select a particular plane (month) by chooosing either the month radio buttons or by clicking on the Next or Prev buttons. The user can also change the alpha value of the non-selected planes by using the slider. Pressing the "A" key on the keyboard enables or disables the axis. The axis has tick marks and text that is always facing the user irrespective of the camera position (see image below)
 |
 |
The user can interact with the 3D object using the
mouse: left-drag to rotate, mouse wheel, or right-drag up and down to
zoom, middle-drag (cmd-left-drag on mac) to pan.
Pressing the Reset button the resets the view to the initial position.
Pressing the Top button on the controller takes the user to the Main
Menu.
 |
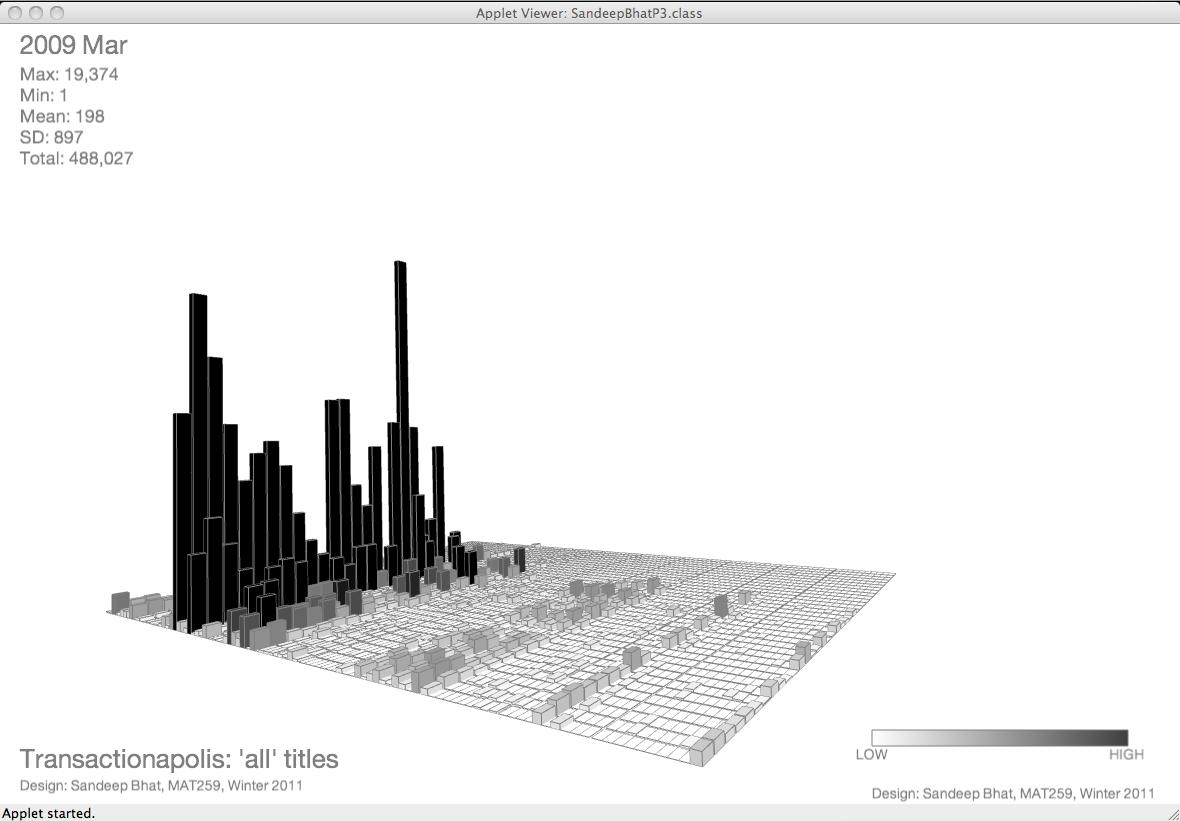 |
The colormap is shown at the bottom-right. The user can press the "C" button to cycle through the different colormaps.
 |
 |
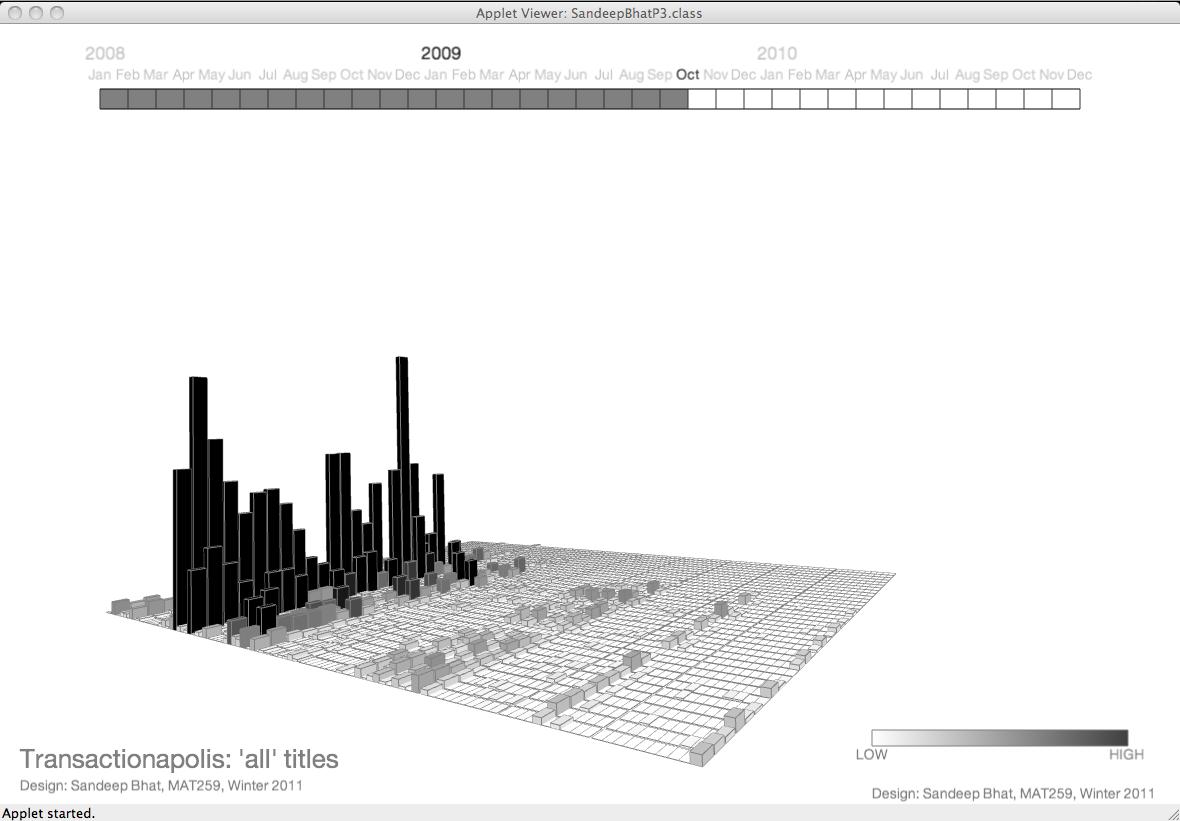
Even while animating, the user can interact with the 3D object using the mouse: left-drag to rotate, mouse wheel, or right-drag up and down to zoom, middle-drag (cmd-left-drag on mac) to pan. The user can turn ON/OFF the axis by pressing the "A" key. The animation can be controlled using the controller window. The user can hide/un-hide the controller by pressing the "." button. Pressing the Stop button pauses/stops the animation. At this stage the user can cycle through the different months by pressing the Prev/Next.
 |
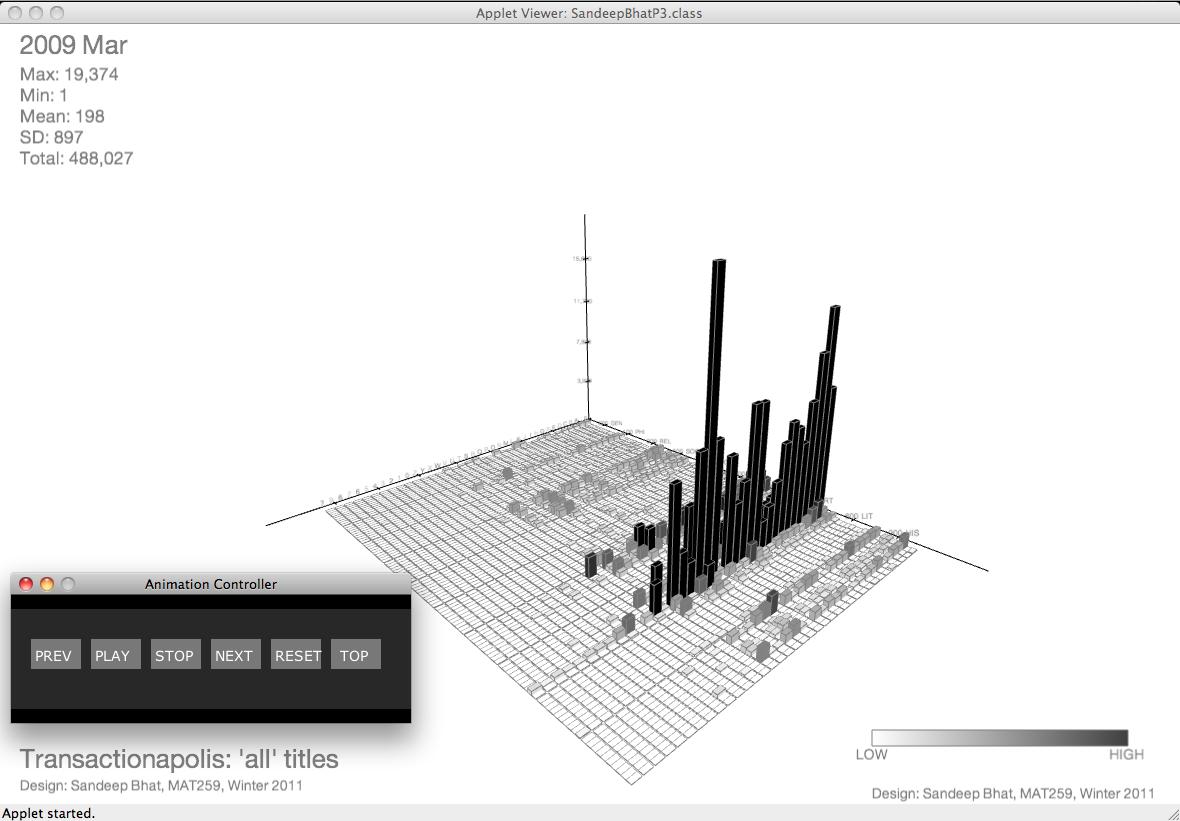 |
Pressing the Reset button the resets the view to the initial position.
Pressing the Top button on the controller takes the user back to the
Main Menu.