MAT259 Design Basics
Minard
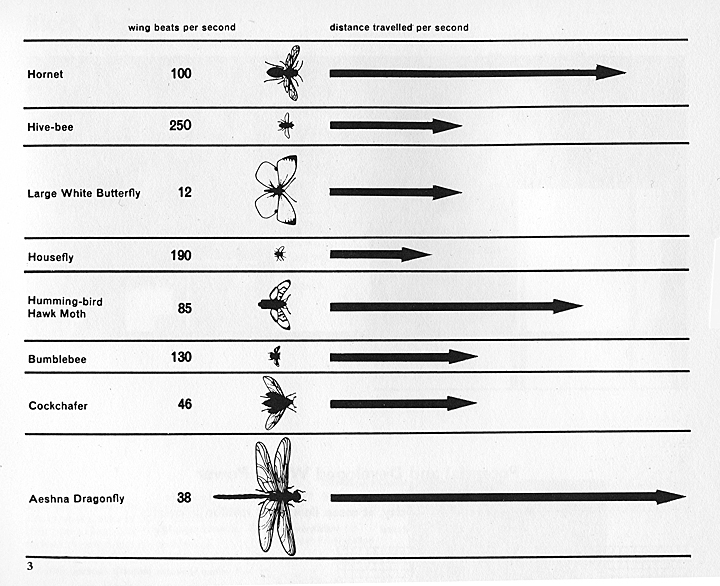
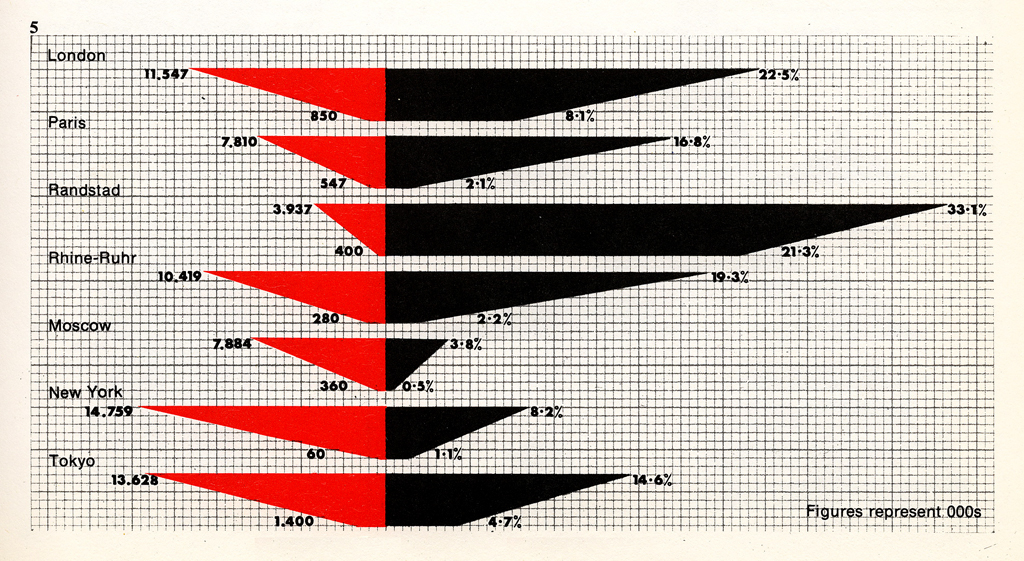
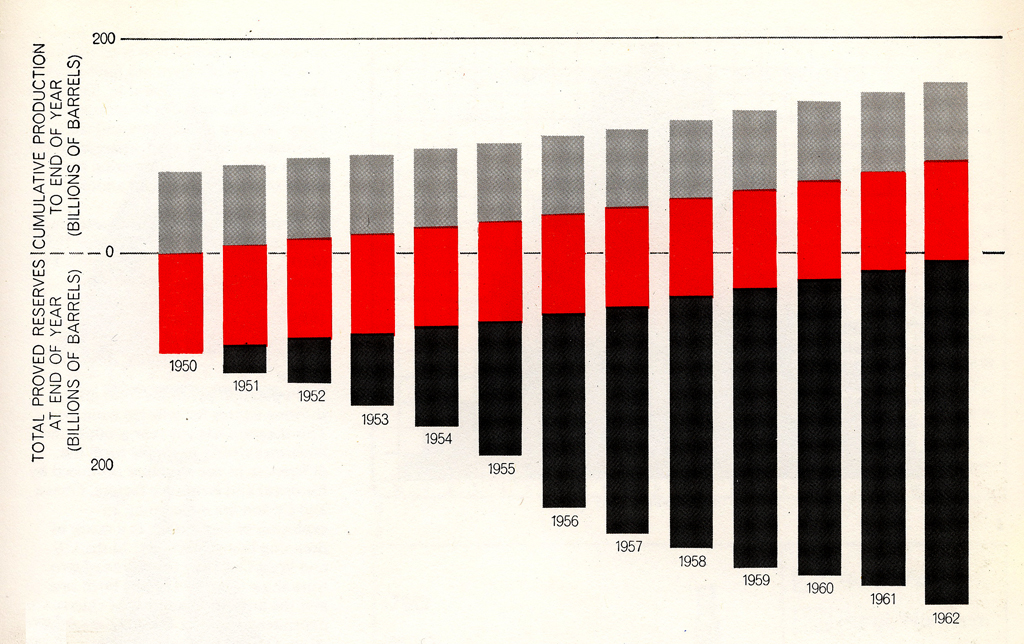
| Marey graph |
[insect_flutter][2directional][3SegmentedGraph]
The Visual
Display of Quantitative Information | Envisioning Information
Cladograms
| Life |
Spatial
2D Mapping
Topological
2D Mapping
Topological
Feltron [1][2][3][4][5][6][7] | Sunsets | Wattenberg
Cybergeography
Spatial Sequence
3D Technical
3D Design
3D Technical
3D Design
Turbulence [more] |
Reza Ali demos wk5, wk6 | Synoptic | Elouini
New York Times
Iraq
2006 | Iraq
2008 | Iraq
2003-08 | Wine |
NYTimes | recession | jobrate | DNA | MichaelJackson | DataVisFun | NY
Times Markets
Helvetica | Futura | Tschibold | Metadesign | HES Geneva (serif)
ASCII: asco-o.com | www |
Architecture
Classic Swiss Graphic Design
LTLWorks | Columbia Arch |
Swiss Graphic Design | Additional Links
Scientific
Cultural
Kandinsky Chart [wpda] [pdf]
2009
2010
2011
Syed Reza Ali | Darren Hardy | Pehr Hovey | Matt Hubert
Laura Devendorf [wordfreq | Eliza Bradley | Zach Rubin
Patrick Freq | Qian Liu | Sandeep Bhat | Karl Yerkes |
Golan Levin
Ben Fry
More
Numbers | Dumpster
Isometrics | Visualizing Data | Valence | Anemone | InfoSeed
We Feel Fine |