FourEyes Lab, Computer Science
TweetProbe: A Real-Time Microblog Stream Visualization Framework
As the importance of social media in our daily life increases, most of people using it witness its significant impact on numerous practices such as business marketing, information science and social sciences. For instance, user-generated information from a few major microblogs are used in order to find consumer patterns on certain type of products. Furthermore, social scientists analyze and predict voting tendencies towards the candidates in a national election. There have been countless research projects conducted on social media datasets in the fields of information science, journalism and so on. In this project, we would like to experiment different visualization techniques with real-time data stream from the major microblog service: Twitter. The project is named as 'TweetProbe' since this visualization framework is designed to present patterns of metadata, topical distribution (in terms of emerging hashtags) and live activities on the current time-window. Particularly, the short time-window used in this project is the key component since it enables users of this application to detect real-time trends, local events, natural disasters and spikes of social signals at microscopic level in time frame.
Project Motivation
User-generated Contents: Major Information Source
- Blogs, Microblogs and Other Services in Social-graph structures
- ‘Big Data’ Becomes a Main Stream in the Field of Data Analysis
Why Microblog, especially Twitter?
- Major Social Media & Fastest Medium
- Real-time Tweet Streams = Statistical Sample That Reflects Live Voices
Objective
Develop a Social-stream Visualizer which provides...
- most influential nodes in the entire/sub-set of the graph.
- most emerging topic in real-time
- event detection on a specific location
- conversations between users and visually represent them as bits of stories
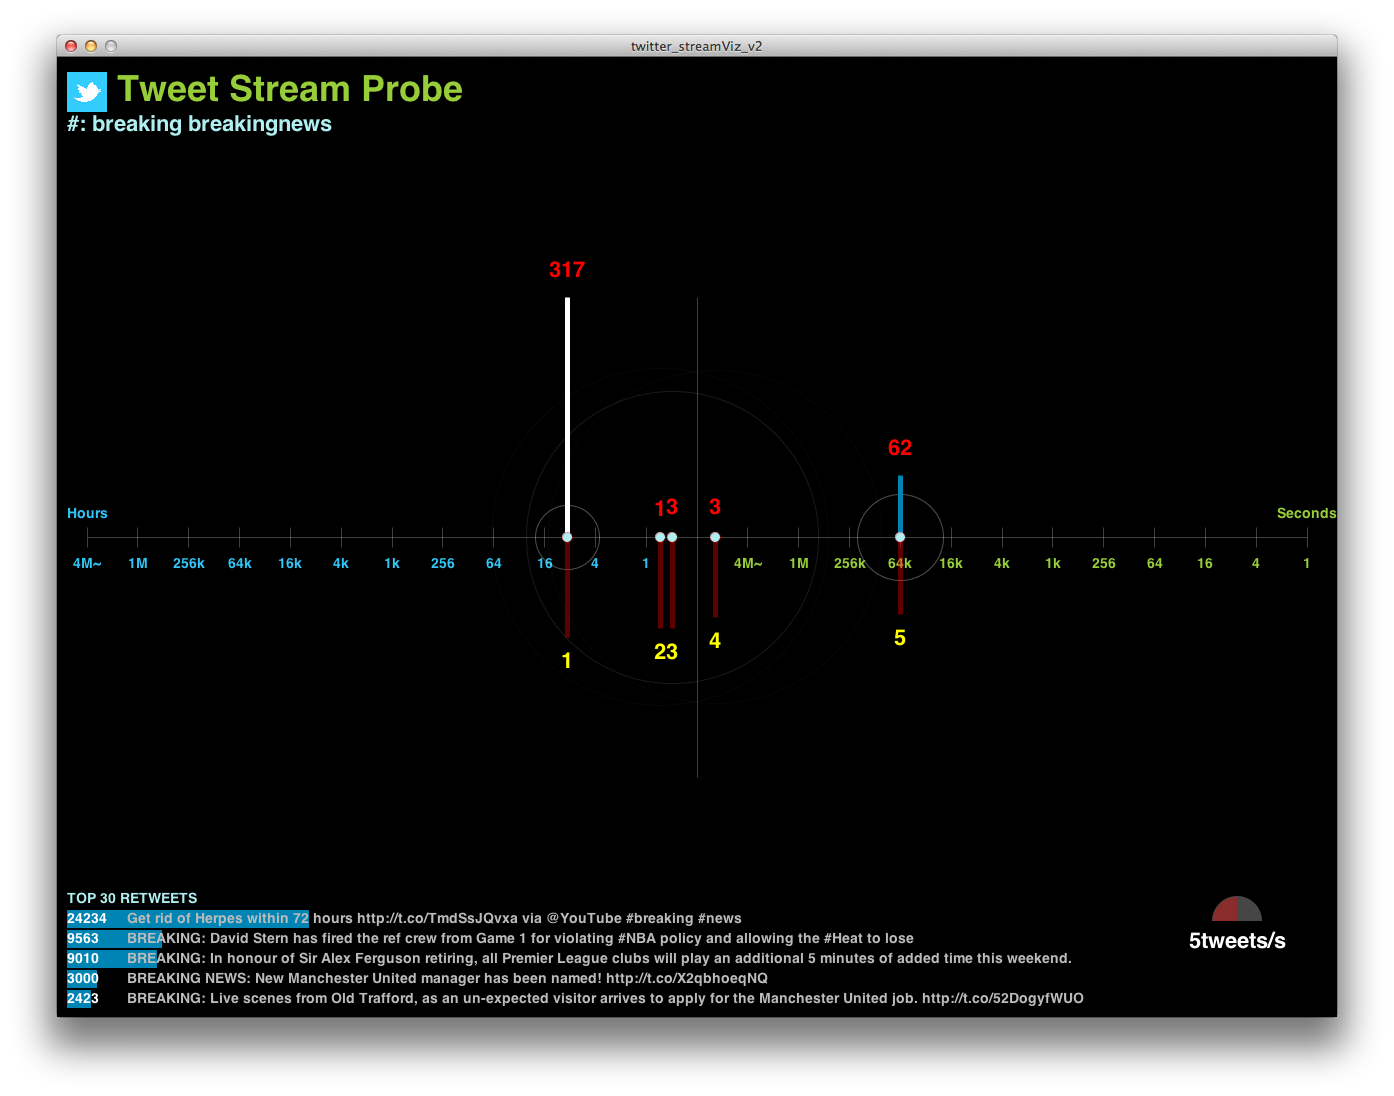
The project is named as 'TweetProbe' since this visualization framework is designed to present patterns of metadata, topical distribution (in terms of emerging hashtags) and live activities on the current time-window.
System Architecture
A. Twitter Stream
In the TweetProbe framework, Twitter Streaming API is used to provide tweet stream in real-time. Twitter Streaming API brings A Real-time Stream of Tweet data
on User Datagram Protocol(UDP) Network Connection.
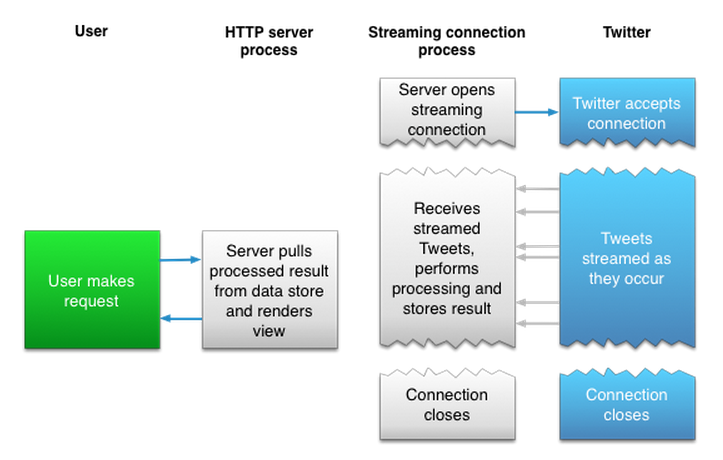
(Excerpt from dev.twitter.com)
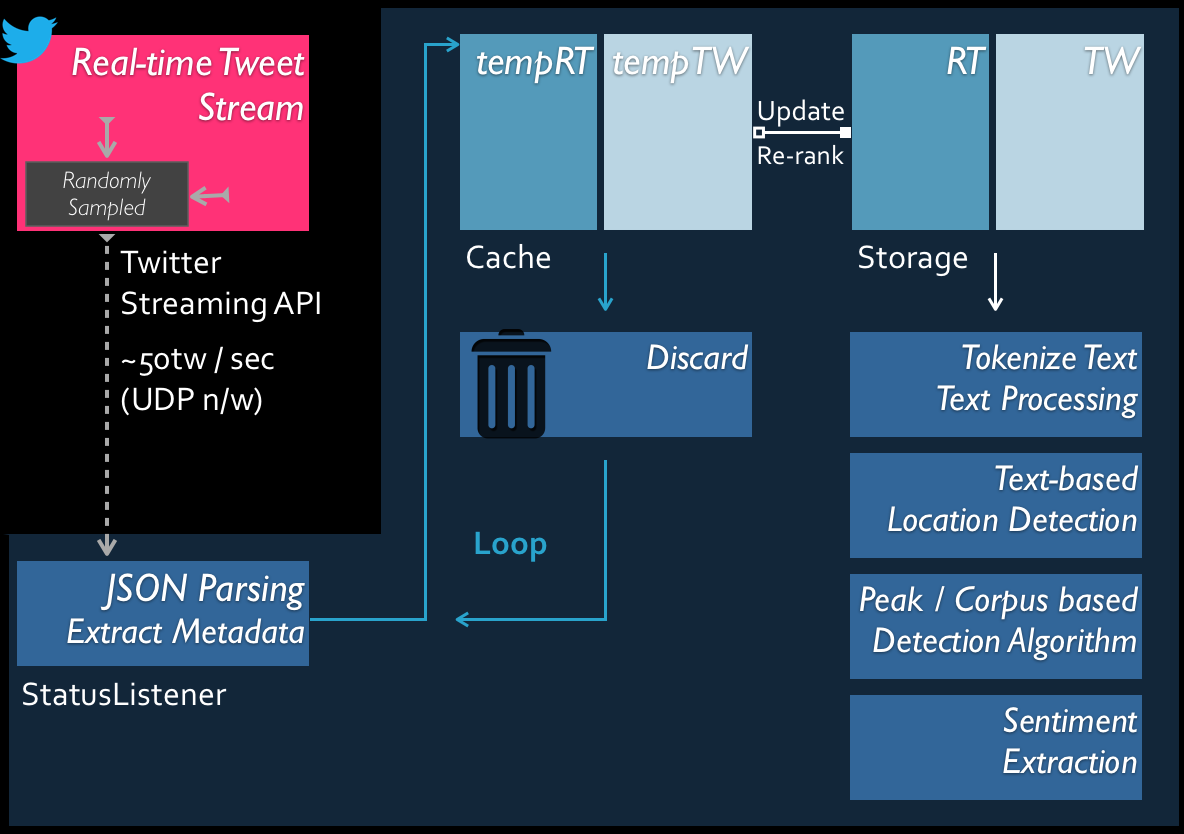
B. Under the Hood (Backend Data Processing)
TweetProbe has a back-end process that generates, produces and updates entities on visualization layers. This process can be described as follows:
1.
2.
3.
4. ...
C. Raw data
[Tweet Metadata]
created_at, id, text, source, in_reply_to_[status_id / user], geo, coordinates, place, retweet_count, favorite_count, entities[hashtags, symbols, urls, user_mentions], favorited, retweeted, possibly_sensitive, lang, etc.
[User Metadata]
id, name, screen_name, location, url, description, protected, followers_count, friends_count, listed_count, created_at, favourites_count, utc_offset, time_zone, geo_enabled, verified, statuses_count, lang, profile_[img/bgimg/color], default_profile, etc.
D. Front End Visualization Layer
TweetProbe Visualization framework has mainly two components: back-end data processing layer and front-end visualization layer. The entire system is developed in Java, but the front end is particularly implemented in Processing. (Processing is an open source programming language and integrated development environment (IDE) built on the Java language. See more on Wikipedia.)
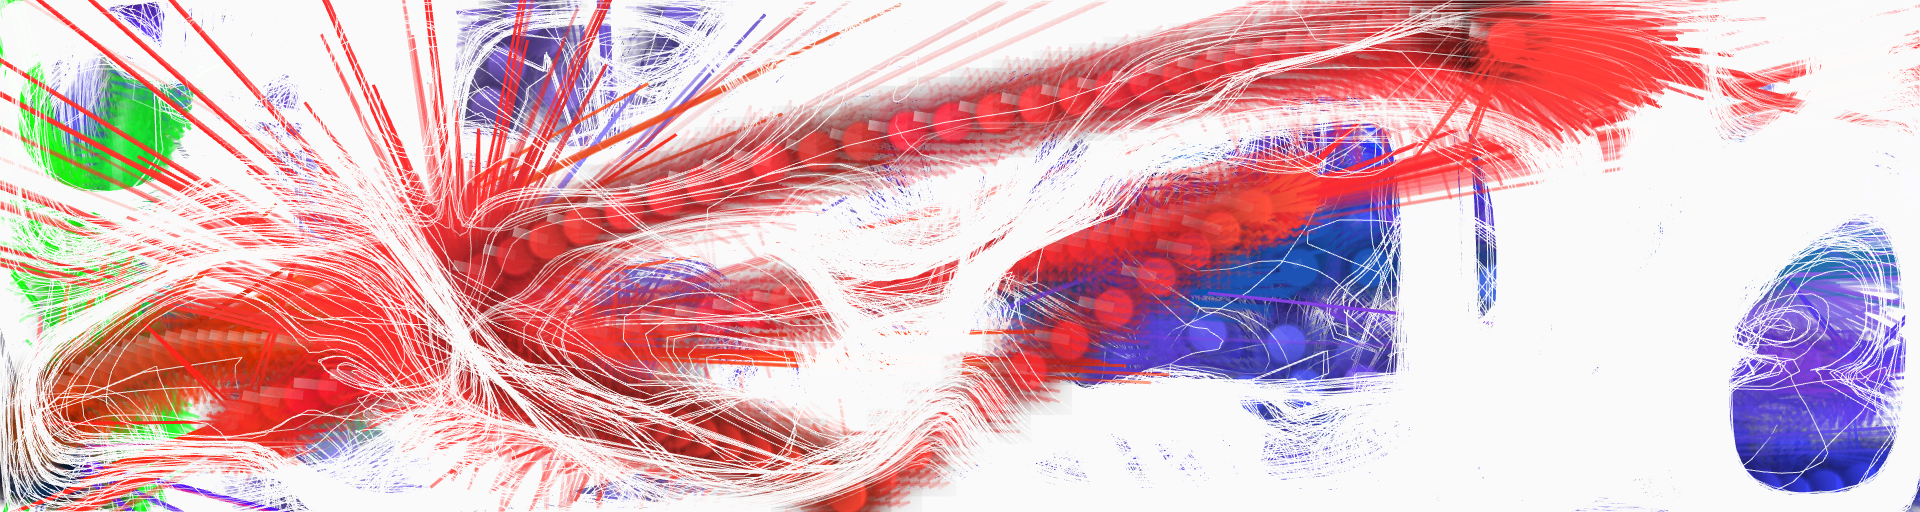
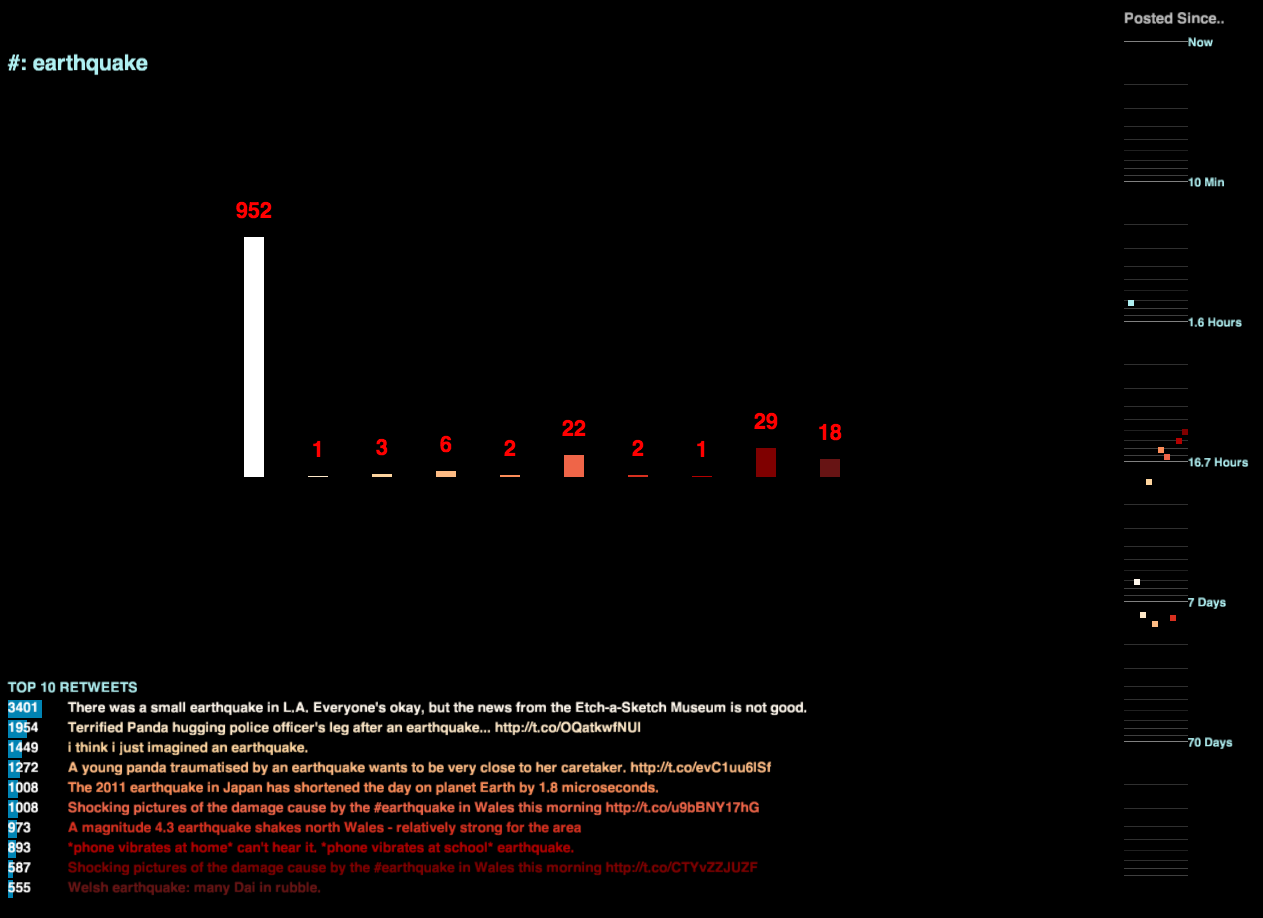
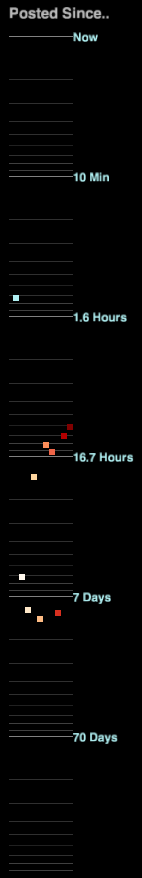
D.1. Raindrop Message Visualizer
This visualizer provides less-organized animated view to users. Although it lacks information to the viewers, we decided to keep this animation in order to deliver more natural feeling of information stream to the intended users. Users can experience stream of messages coming through in multiple visual components.
(a) Particle (message drop) size : it varies depending on the retweet count of each message.
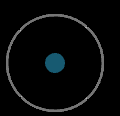
(b) Diameter of fading out ring (Animation duration) : It varies depending on the number of followers of each author.
(c)
Particle color : Green=retweet, Blue=tweet
(d) Text bound to a particle : Author's registered location.
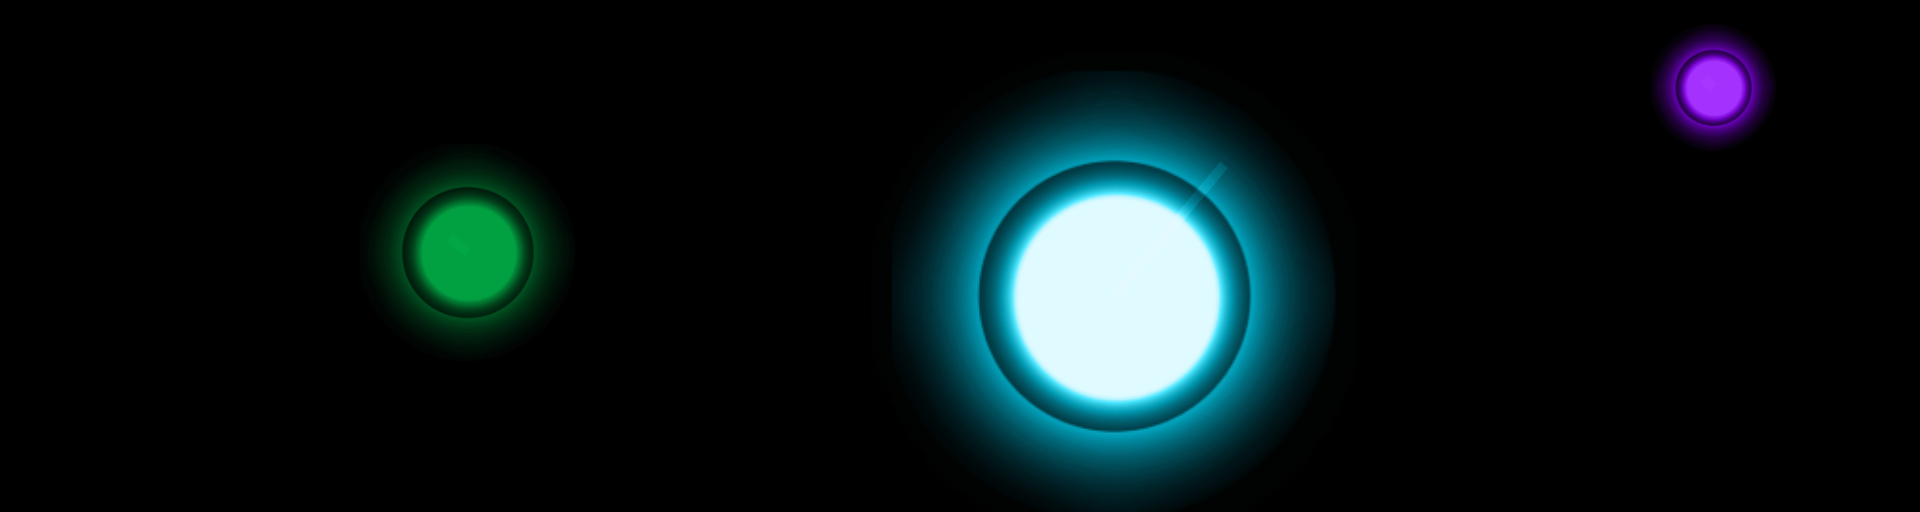
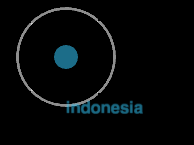
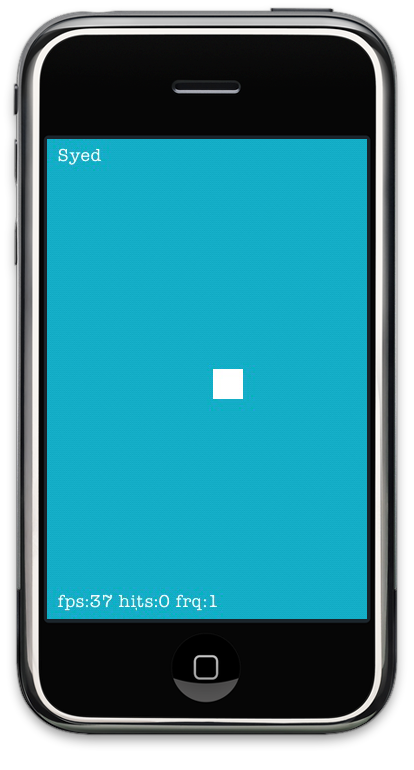
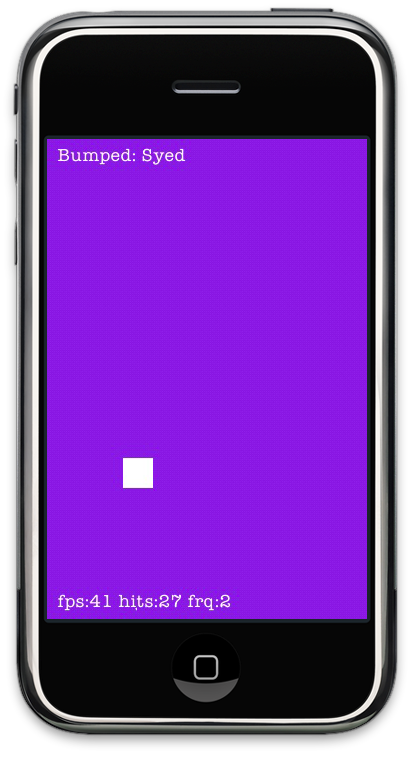
The iPhone application provides a minimal yet natural interface for interaction with the installation. The application tracks finger positions on screen, (as seen by the white square in the images above), taps, proximity, device orientation, and audio input (from the microphone) to provide multimodal input to the installation. The application provides multimodal feedback using the display, speaker, and vibration capabilities of the phone. These input and output mechanism are critical in allowing an audience member to engage and feel part of the installation. The Processing application handles how a user is displayed and is sonified in the installation. Additionally, the application is able to differentiate users from each other by uniquely representing every participant with their own avatar on screen. When a user turns on the iPhone application he/she connects to the Processing application, where orbs represent individual participants in the installation. In the first image above there are three participants in the installation.
The user is able to use their phone screen as a track pad to move their avatar in the virtual space. The iPhone's orientation will determine the color of their phone screen, which correlates to the color of their orb in the virtual space. Moreover, if a user covers the proximity sensor on their phone then their avatar is hidden in the installation space (their orb disappears). When a participant is hiding he/she is not able do anything else in the virtual space until they come out of hiding. Moreover, if the user was to tap of their screen with two fingers they would trigger a sound in the installation, moving around in the installation also triggers their sound. Moreover if a user taps on their screen with three fingers they release a missile into the virtual space, which can hit other participants in the space.
Future work:
...