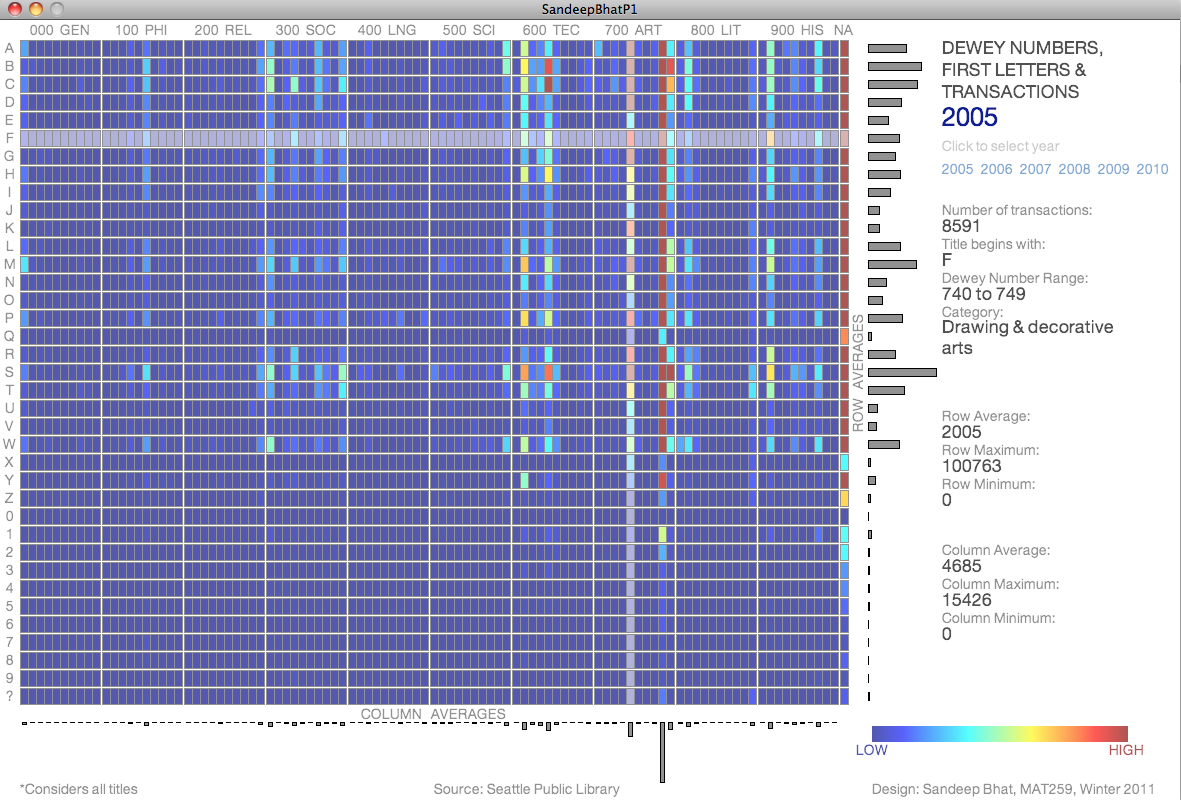
MAT 259 - 2011W


Sandeep Bhat | Project 1 | 2D Frequency Visualization

Dewey Numbers, First Letters and Transactions 2005 - 2010


Description

This project tries to study the number of transactions in a given year as a function of both the dewey numbers and the first letter of the title. The goal of the project was to see if there would be any interesting patterns to be found when transactions was seen as a functions of first letter of the title and the Dewey classes to which the item belongs to. In the following description the Dewey Number-First Letter pair (or cell) would be referred to as a DewLet.

The project was realized using Processing. The visualization is based on the data got from the spl_all database hosted on tango.mat.ucsb.edu. This database contains information about all the transactions in the Seattle Public Library done between 2005 and 2010. For this project only the deweyClass and title fields are being considered.

Quick Links

Applet | Source Code | First Screen | DewLet Selection | Year Selection | ColorMap Selection | DataSet Selection


Initial Doodle

Initial doodle of the visualization.

Doodle


First Screen

The applet begins with the following layout. 

X Axis -has the Dewey Classes grouped by their hundreds place digit. Each DewLet inturn contains data for 10 Dewey classes. NA is for No Dewey. 

Y Axis - Shows the first letters of the title ignoring common words like "the", "in", "of", "A", "An". ? is for unrecognized characters.

Bargraphs show the averaged along rows and columns. 

The colorbar index shows colors ranging from LOW transactions to HIGH transactions.

By default the information shown considers all available titles in the SPL database from the year 2010.

Default Layout


DewLet Selection:

Hovering the mouse pointer over a Dewlet brings up the crosshairs for making easy selection and the InfoBox at the right. It gives information not just about the selected DewLet (cell where the crosshairs intersect) but also about the Row and Column to which the DewLet belongs. Hovering over the grid changes the information in the InfoBox to that corrsponding to the selected DewLet. 

Note: In the Java Applet you need to first click on any DewLet to get the crosshairs going.


Year Selection

Clicking over the years to the right brings up the information for that year. The same selection can be made in several different ways. You can press number keys 5-9 and 0 for years 2005-2009 and 2010 respectively. You can press [ or ] to cycle through the years in decreasing or increasing order. When you reach the end, 2005, the graph comes back to 2010 and vice-versa. Images below show the visualization for 2007 and 2005 respectively.


ColorMap Selection

The colormap can be changed by pressing the C key. You cycle through the colormaps as  JET-SUMMER-COPPER-JET.

The following images show the jet, summer and copper colormaps. The colormaps were obtained using MATLAB.

JET COLORMAP

SUMMER COLORMAP

COPPER COLORMAP


DataSet Selection:


Pressing the D key changes the dataset displayed. The datasets are "all"- "hate" - "love" - "photography" - "all"
  • All - considers all titles
  • Hate - only considers titles containing "hate", "war", "bad", "evil"
  • Love - only considers titles containing "love", "like", "peace", "good"
  • Photography - only considers titles containing "photogrpahy", "camera", "SLR", "digital", "lens"

The selection is shown in the lower left hand side of the plot.

Following images shows the different datasets visualized using JET colormap.

HATE DATASET


LOVE DATASET


PHOTOGRAPHY DATASET


APPLET

Mouse Inputs

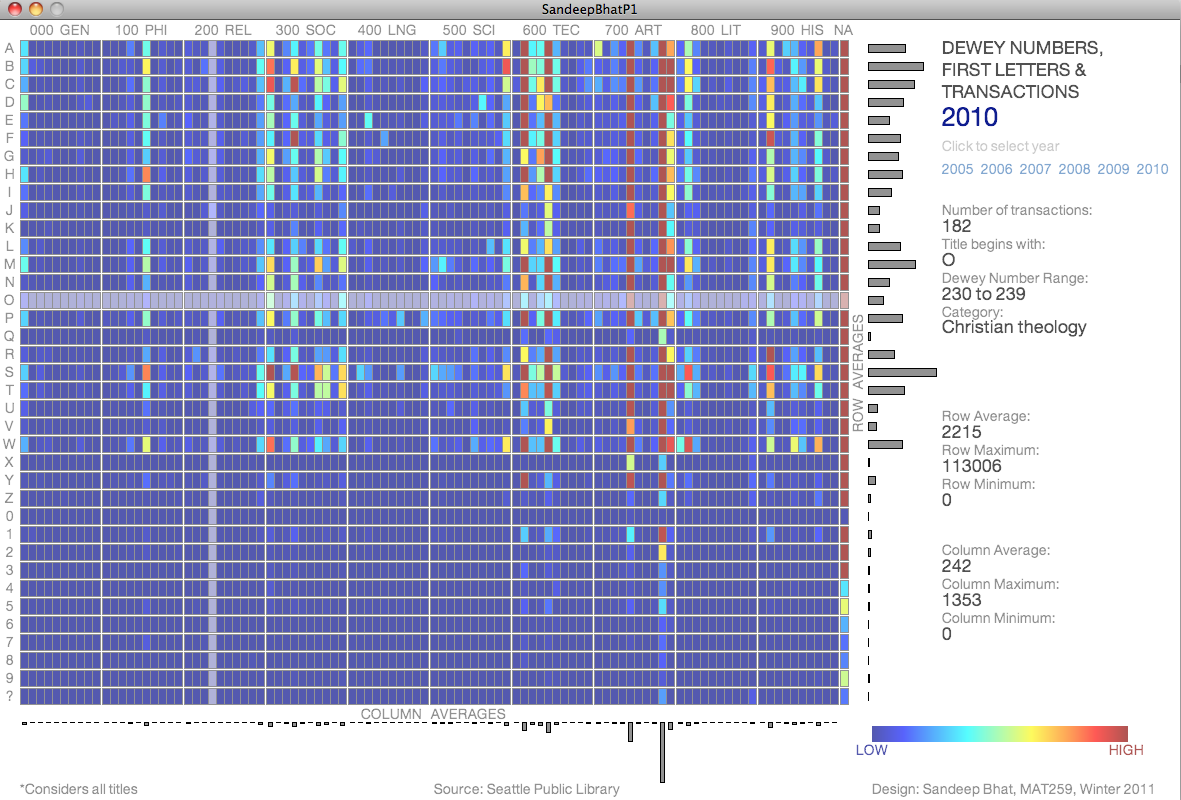
  • Click on any cell to get the corsshairs going; the info box at the right will show information corresponding to the Dewlet.
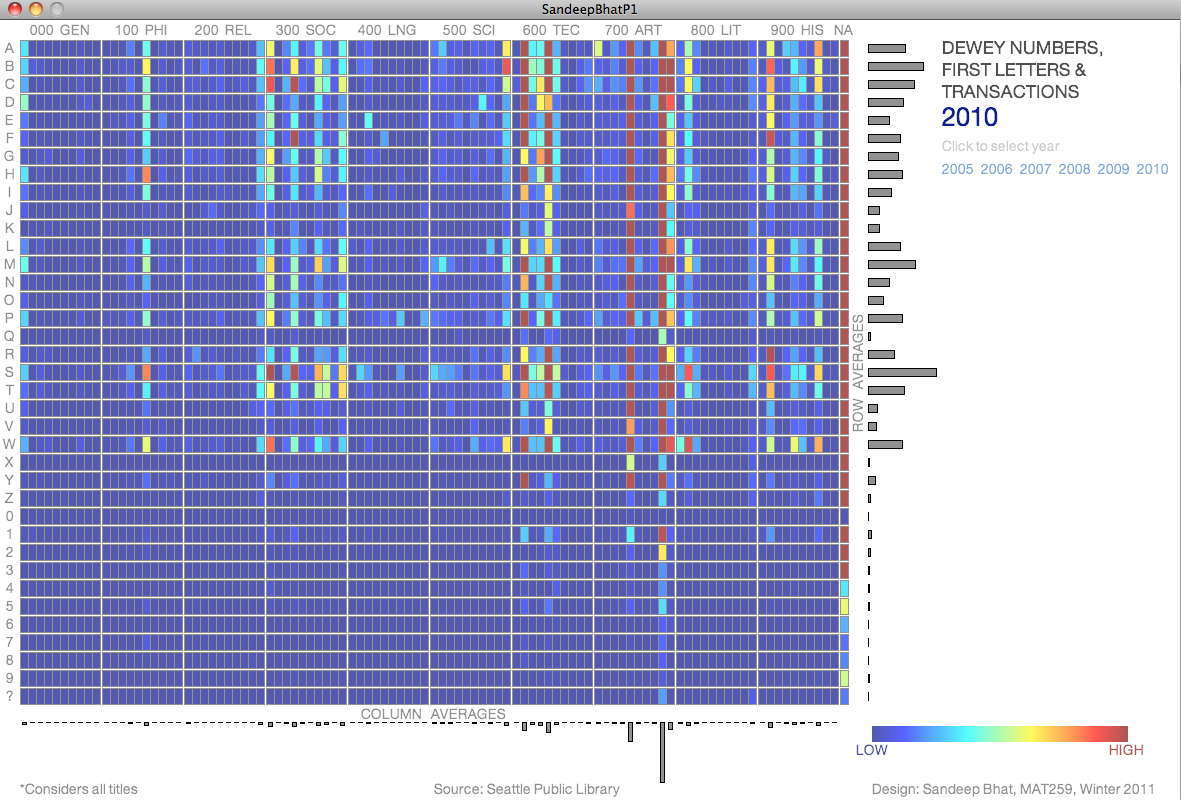
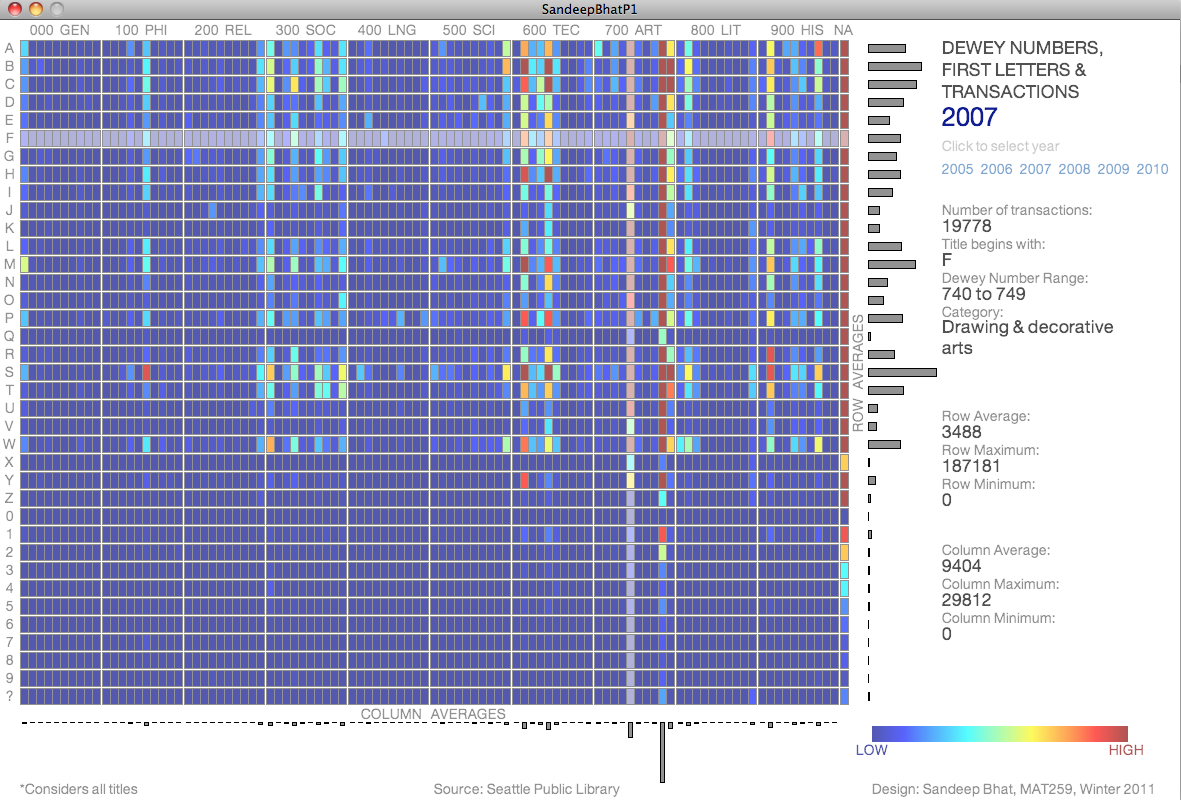
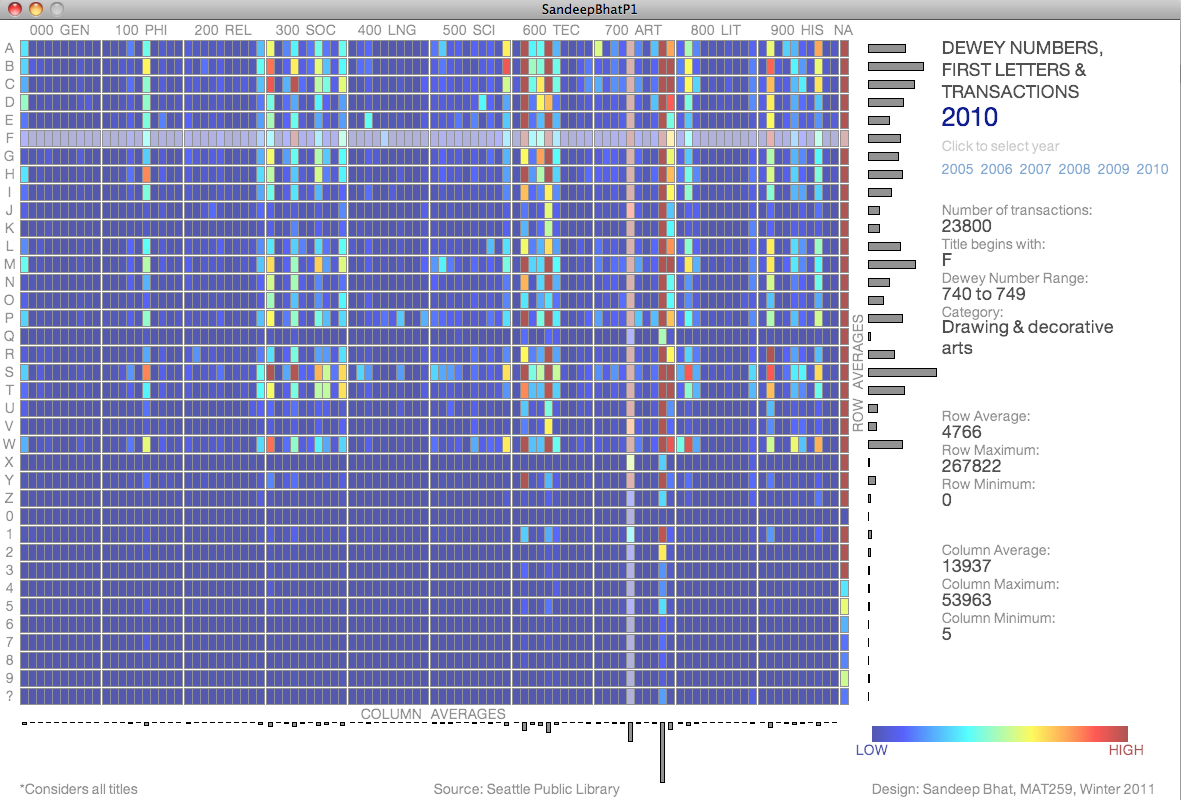
  • Press the years 2005-2010 to select the year for which the Data is displayed.

KeyBoard Inputs

  • Press 5 - 9 to select 2005 - 2009
  • Press 0 to select 2010
  • Press ] or Right Arrow to select Next Year (2005 - 2006 - 2007 - 2008 - 2009 - 2010 - 2005)
  • Press [ or Left Arrow to select Prev Year (2010 - 2009 - 2008 - 2006 - 2007 - 2005 - 2010)
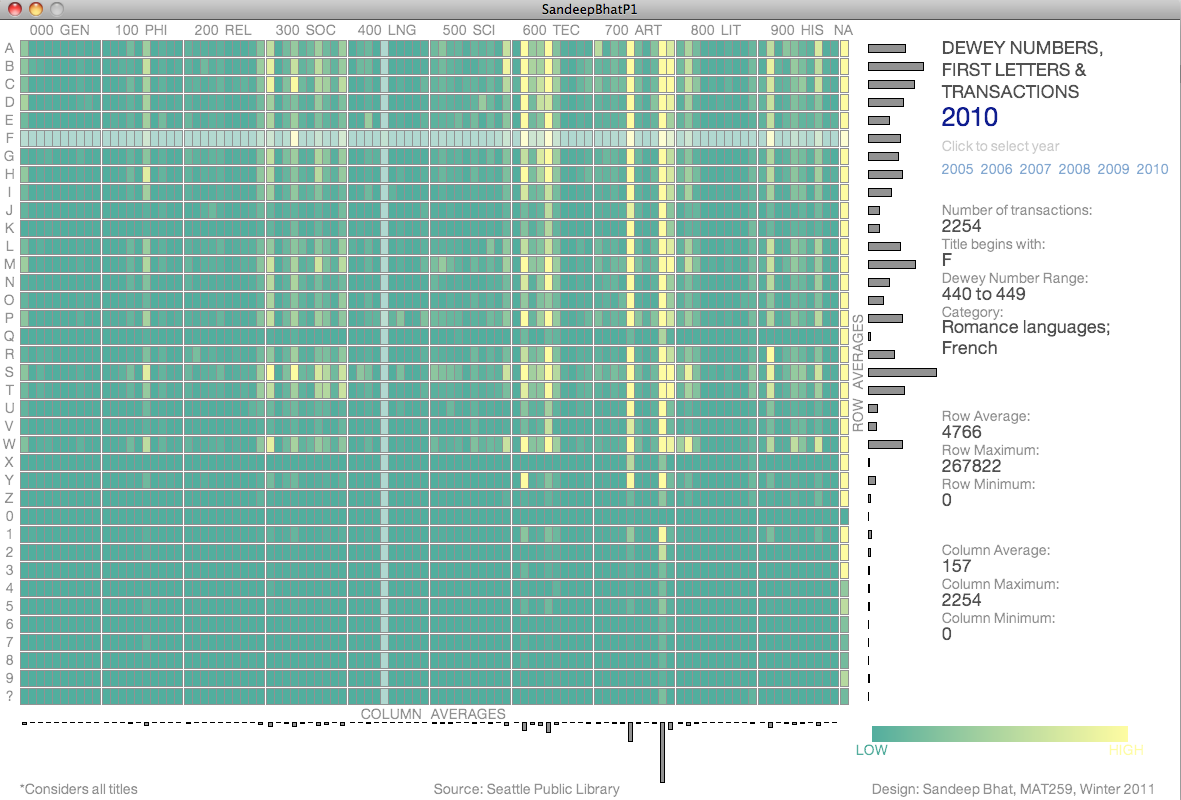
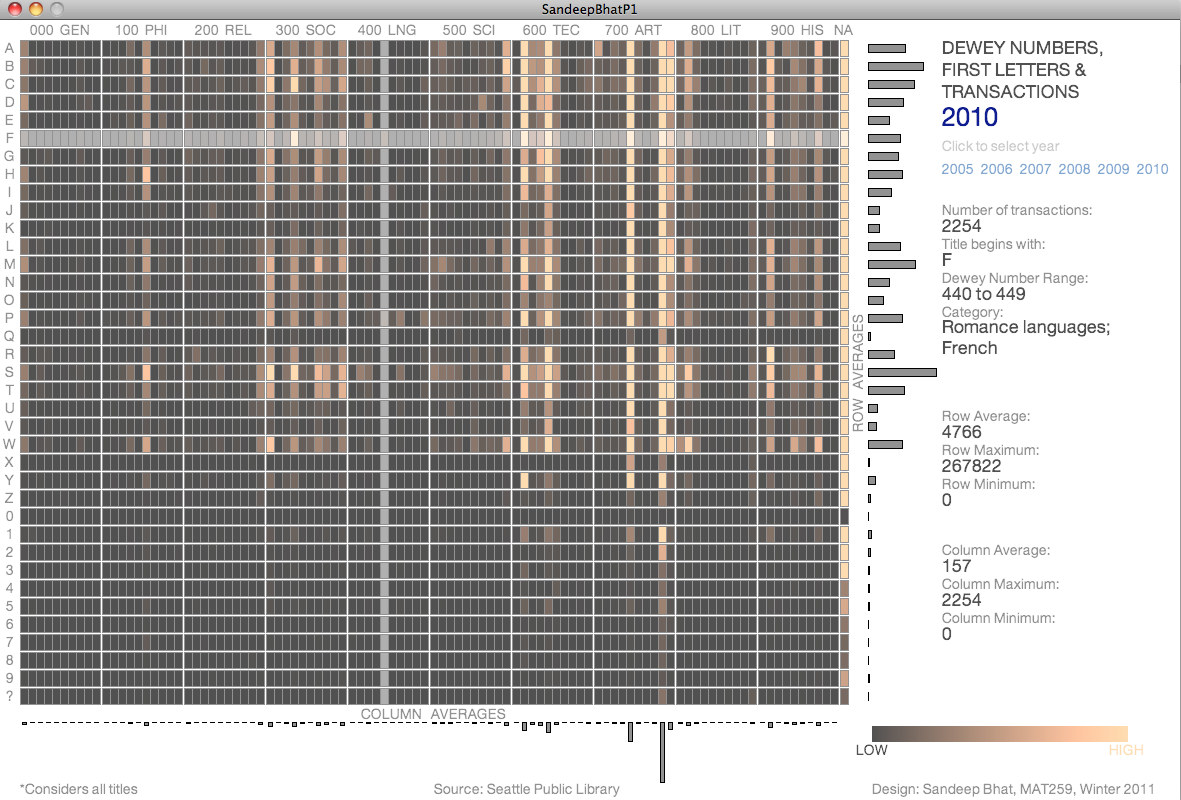
  • Press C to change Color Map (Jet - Summer - Copper - Jet)
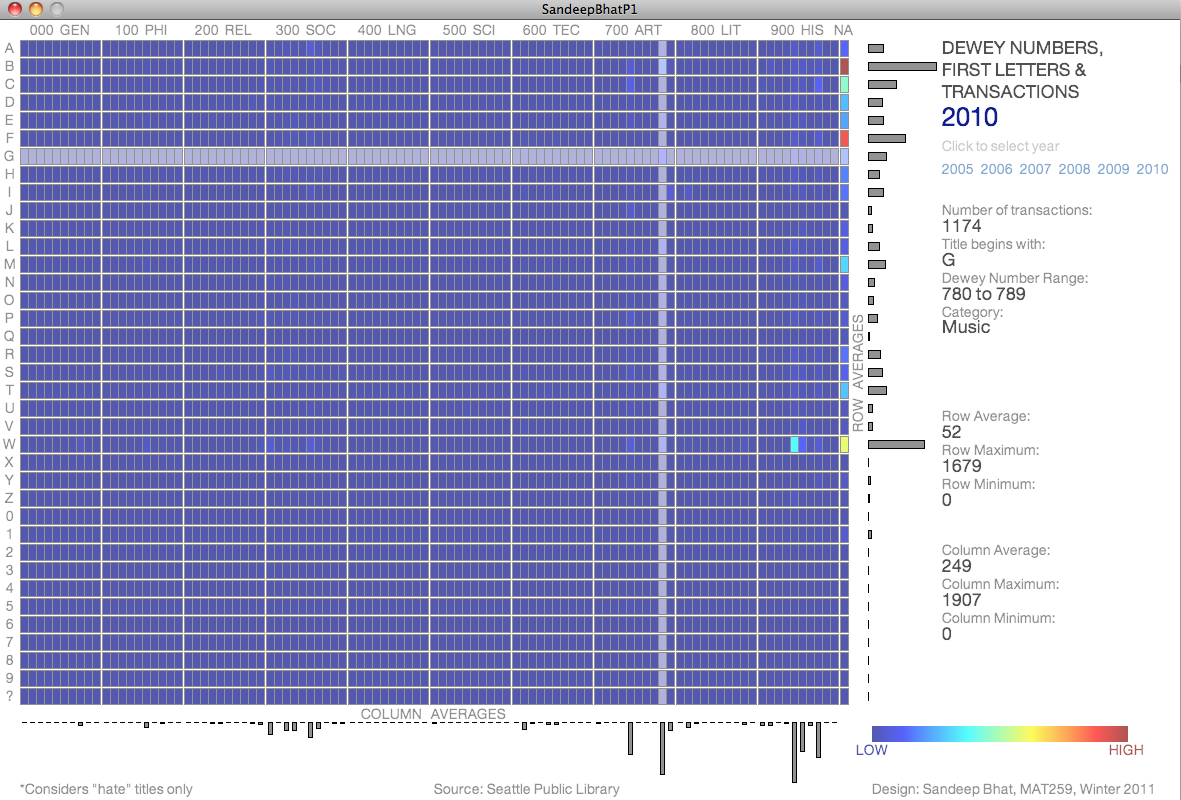
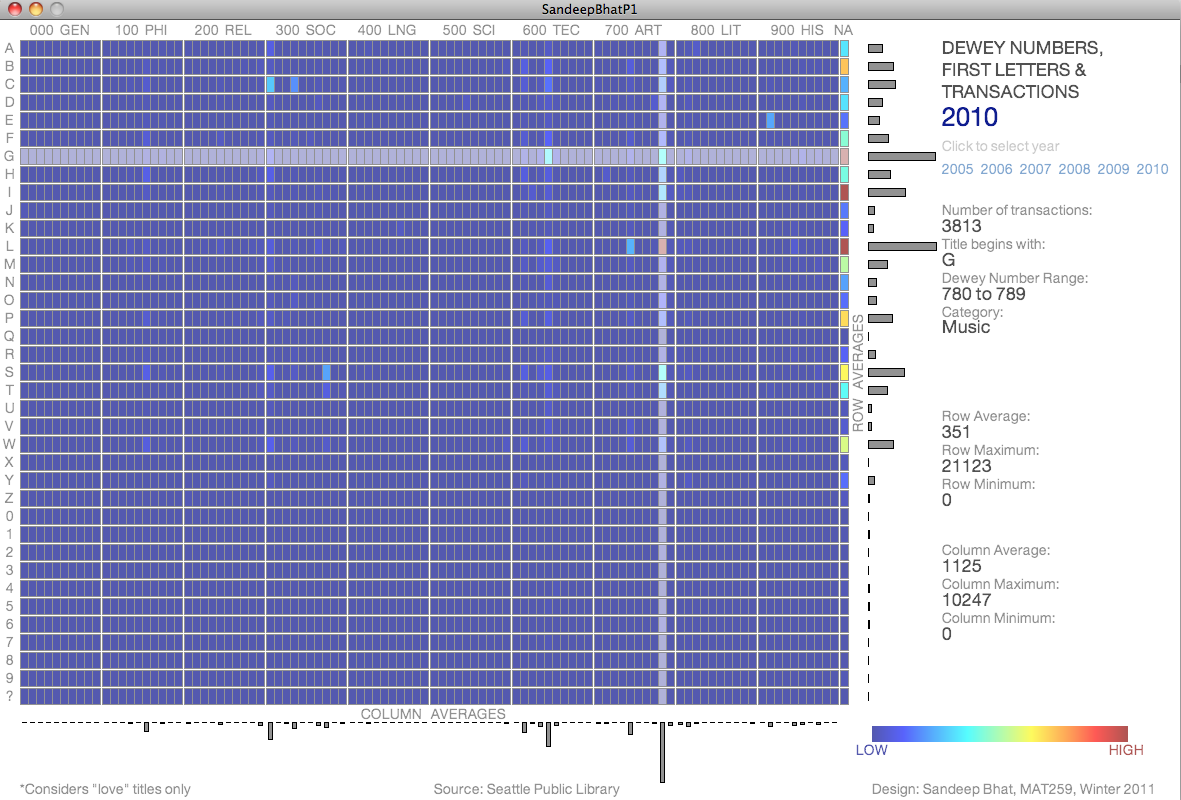
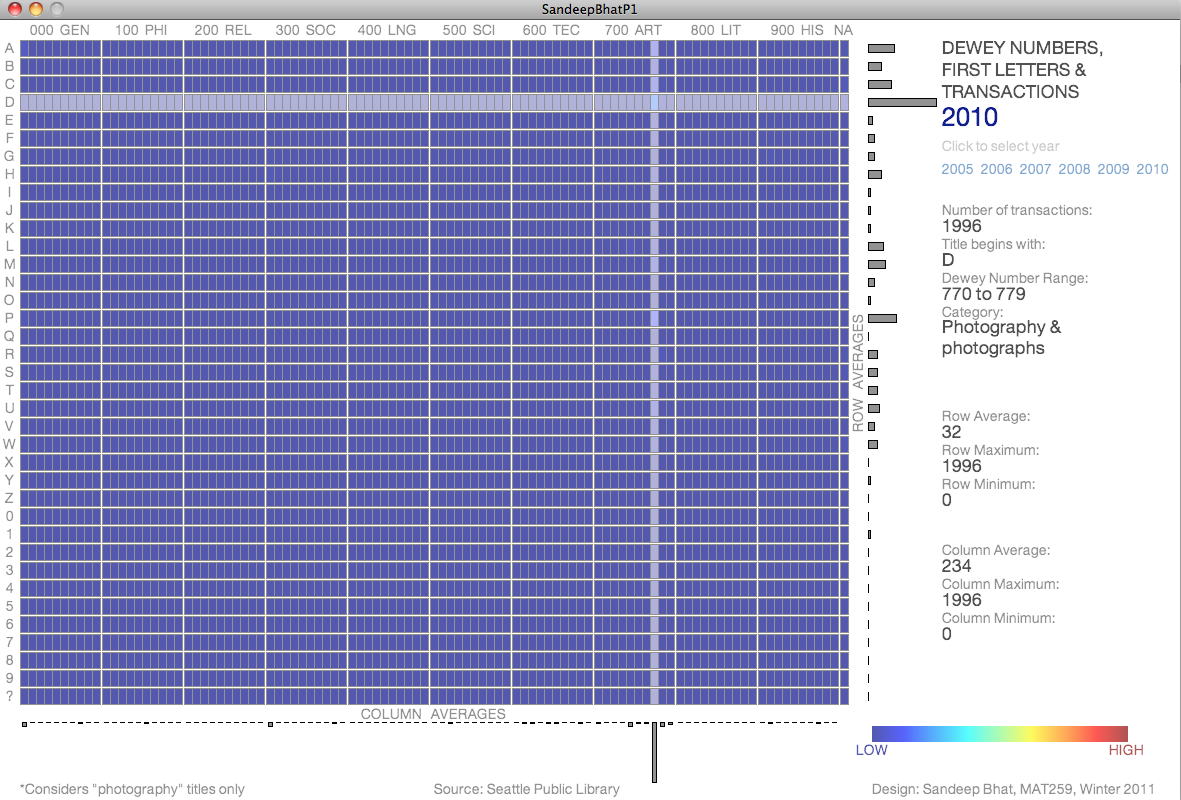
  • Press D to change Datasets ("All" - "Hate" - "Love" - "Photography" - "All")

Source code:

SandeepBhatP1 Cell ColorMaps DeweyLetterMatrix DeweyLetterStrings StatCalc

Copy all the above source files to the same folder. Download and unzip the precomputed datasets to the same folder. The zip contains text files containing the transaction counts. Double click to open the SandeepBhatP1.pde file in Processing and run the code.

Built with Processing