MAT 259 - 2011W
Checkout stacks
Description
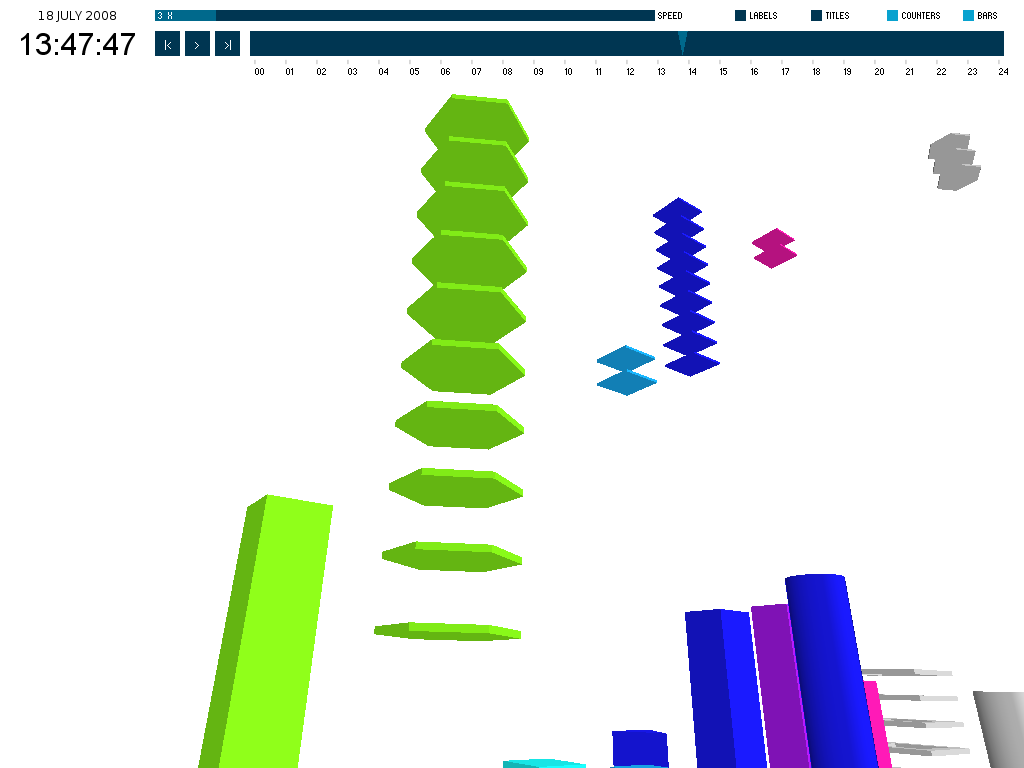
The goal of this visualization is to show both global and detailed information about the activity in a single day at the Seattle Public Library. The core of the visualization is a real time (or accelerated) 3D animation showing the titles appearing when they are checked out, and then forming stacks that act as checkout counters. Peaks and lulls in activity at the library are directly reflected by the activity in the animation.
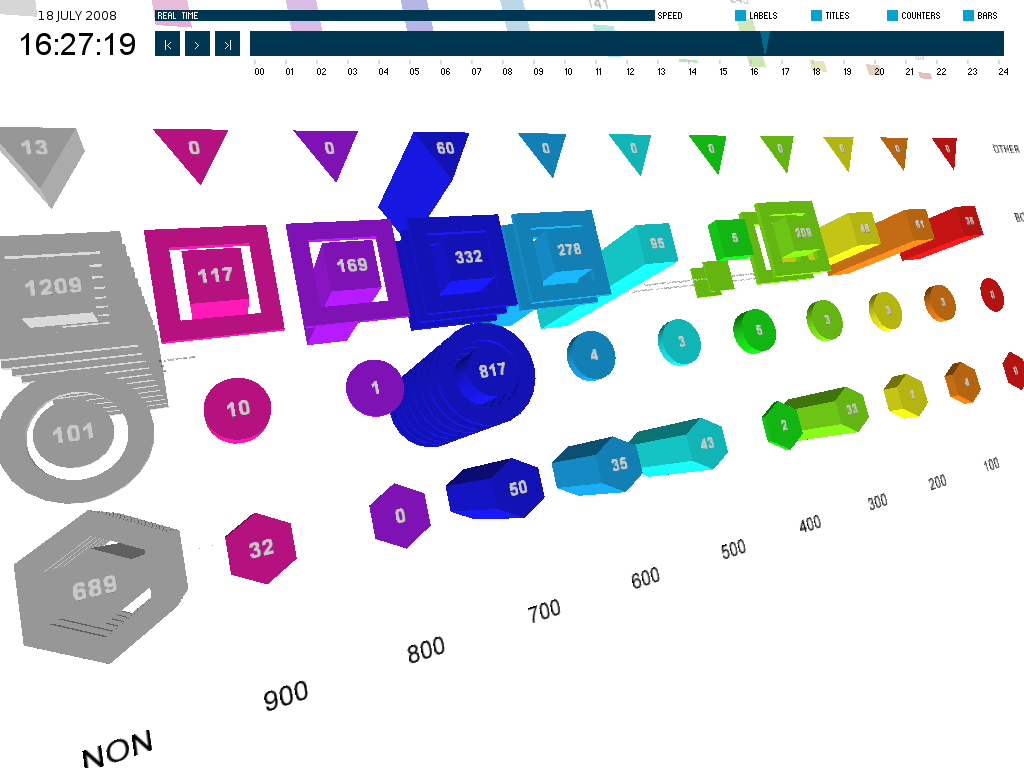
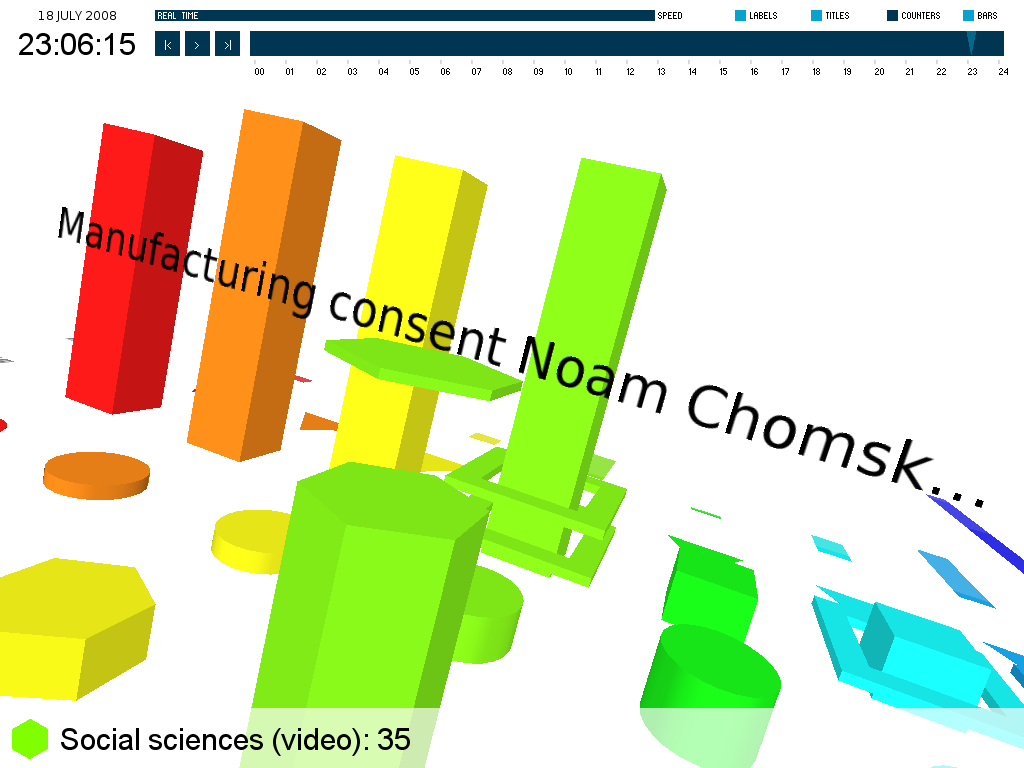
The titles in the visualization are categorized based on their Dewey class and their item type. There are four item types in the visualization: video (DVDs and VHS tapes), audio (CDs and cassettes), books, and other (anything else). The Dewey classes are color coded, the item types are represented by different shapes (hexagon, circle, square and triangle).
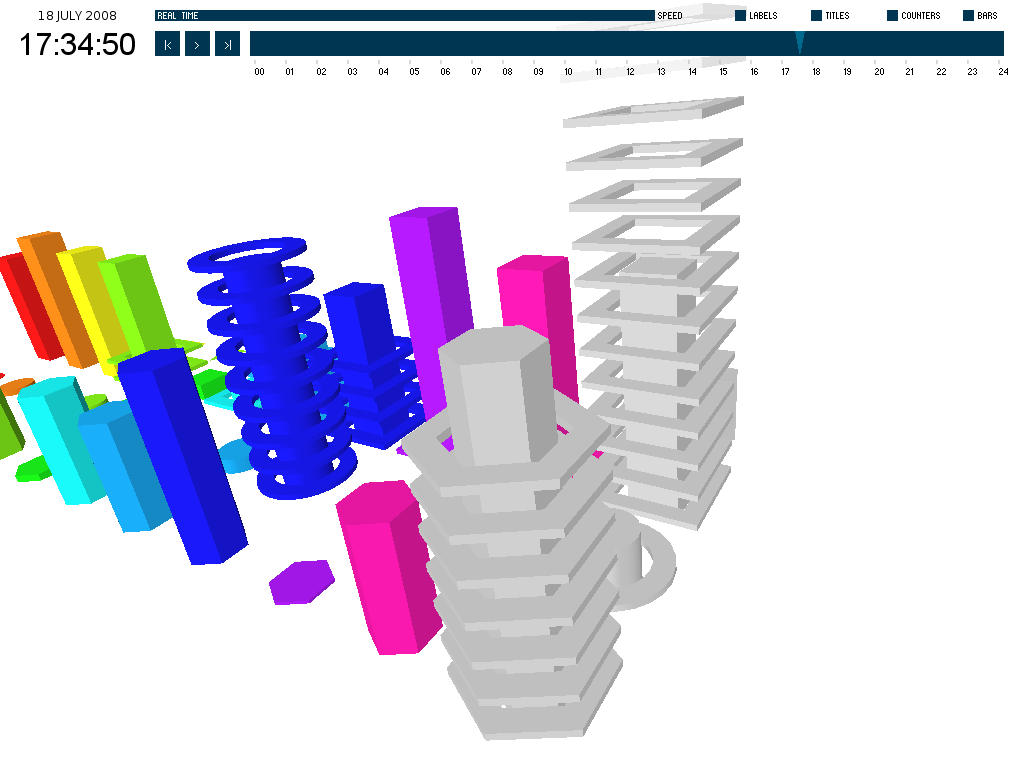
Each category (combination of Dewey class and item type) has a stack representing the number of checkouts for that category. When a title is checked out from the library, it is added to the visualization as a drop (colored shape based on the title's category). The drops slowly fall to their corresponding stack; as titles fall onto the stack, the stack grows in size. When the stack reaches a multiple of 100 checkouts, it collapses and a ring is added around the stack (each ring represents 100 checkouts).
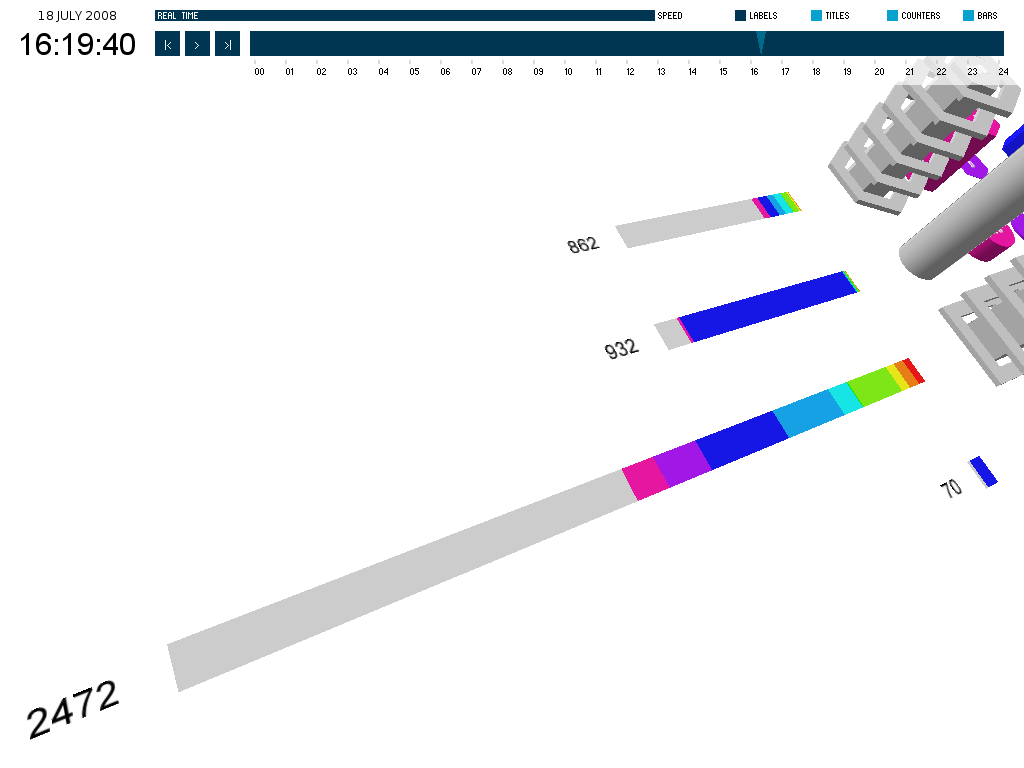
Optionally, the visualization also shows the total checkouts for the Dewey classes (regardless of item type) and item types (regardless of Dewey class) as 2D bar charts aligned with the 3D stacks.
Data source: The Seattle Public Library
Instructions
The widgets at the top of the screen control the visualization. At the very top is a thin slider that controls the speed of the animation. Below that is a slider that indicates the time of day, it moves as the animation plays and can be used to jump to a time of day. To the left of that slider are buttons that can be used to step back, pause/play, and step forward the animation (the steps are equal to the currently selected animation speed). In the top right corner are four checkboxes that can be used to show or hide parts of the visualization.
The camera is controlled by dragging the mouse. To rotate the camera drag with the left button pressed, dragging with the right button zooms in and out. The camera can be panned by dragging with the middle button (or with the left and right buttons simultaneously).
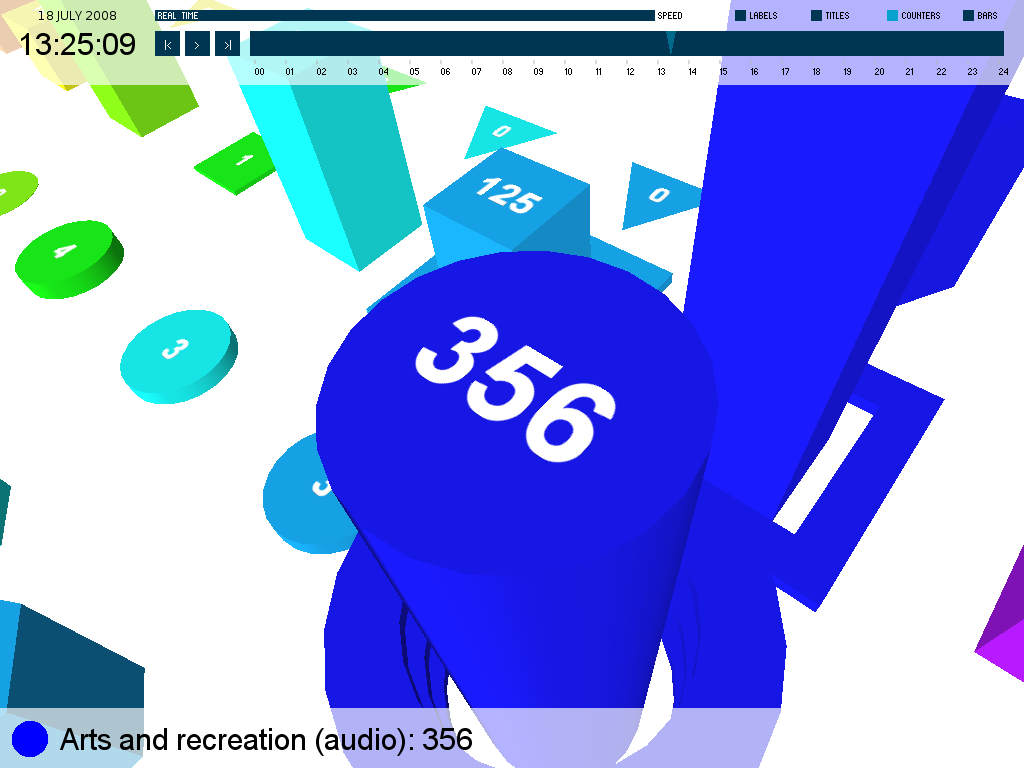
Clicking on a stack will select it and display (at the bottom of the screen) its full Dewey class name, item type and checkout count. Double clicking on a stack, or pressing the space bar while a stack is selected, will zoom in on the top of the stack.
Visualization
Screenshots