2008W
Instructor
TA
MAT259 Visualizing Information(4 units)
George Legrady
Charlie Roberts
Lecture: Tuesday 10:00-12:00, Lab: Thursday 10:00-12:00 - e-studio/Arts2220
A lecture and lab course to explore the visual organization
of information. Lectures, readings and technical demos will focus on a
range of conceptual models of data visual mapping as implemented in various
disciplines, artistic, statistical and scientific, that are used to represent
information visually.
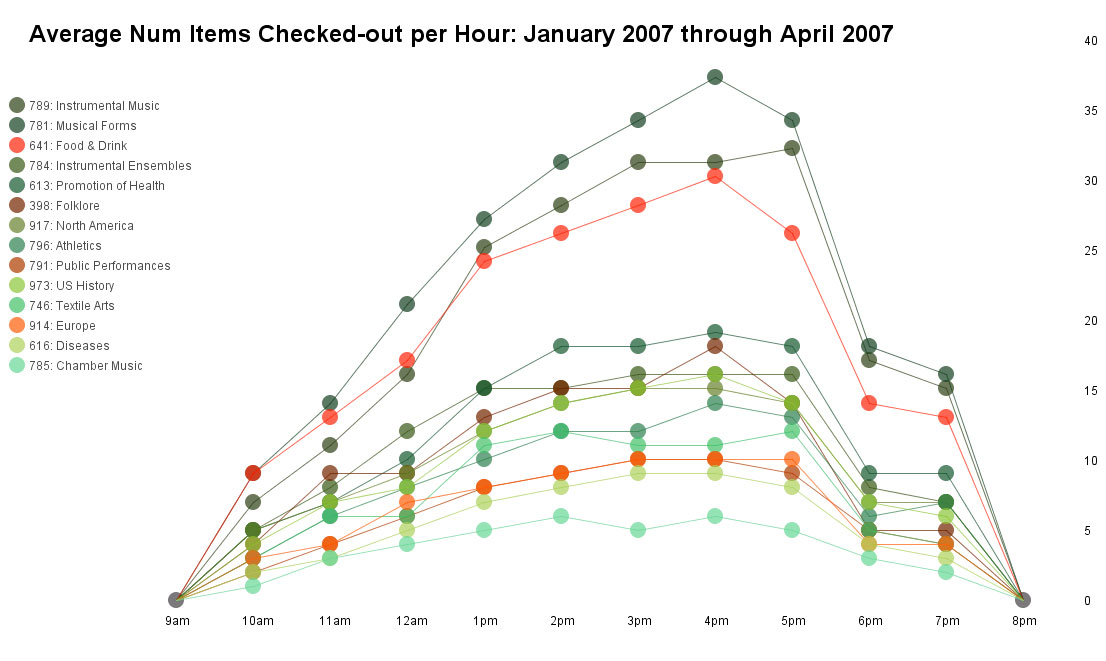
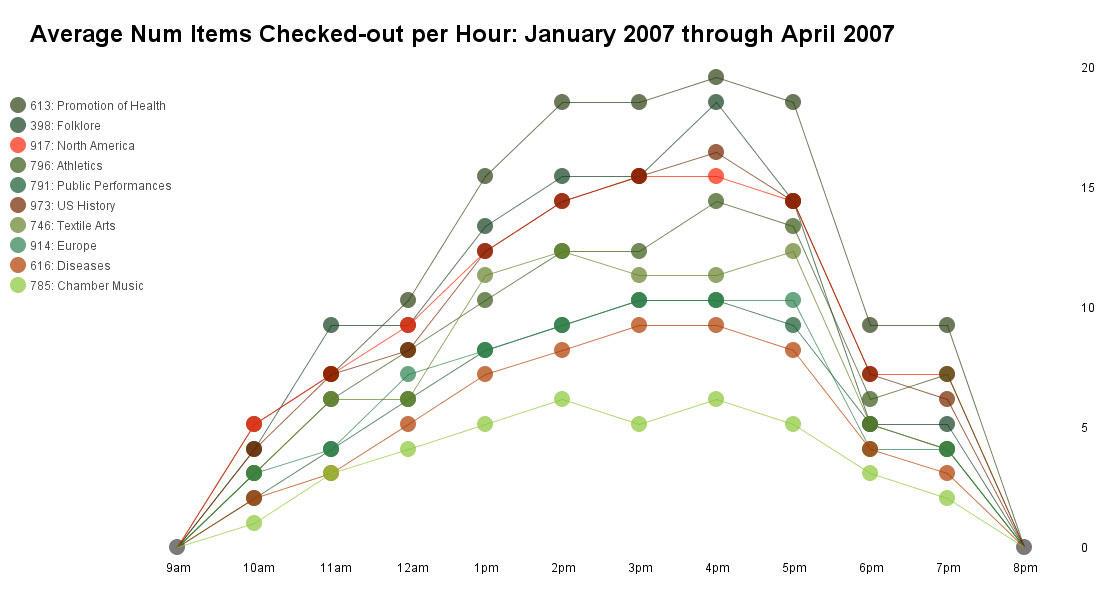
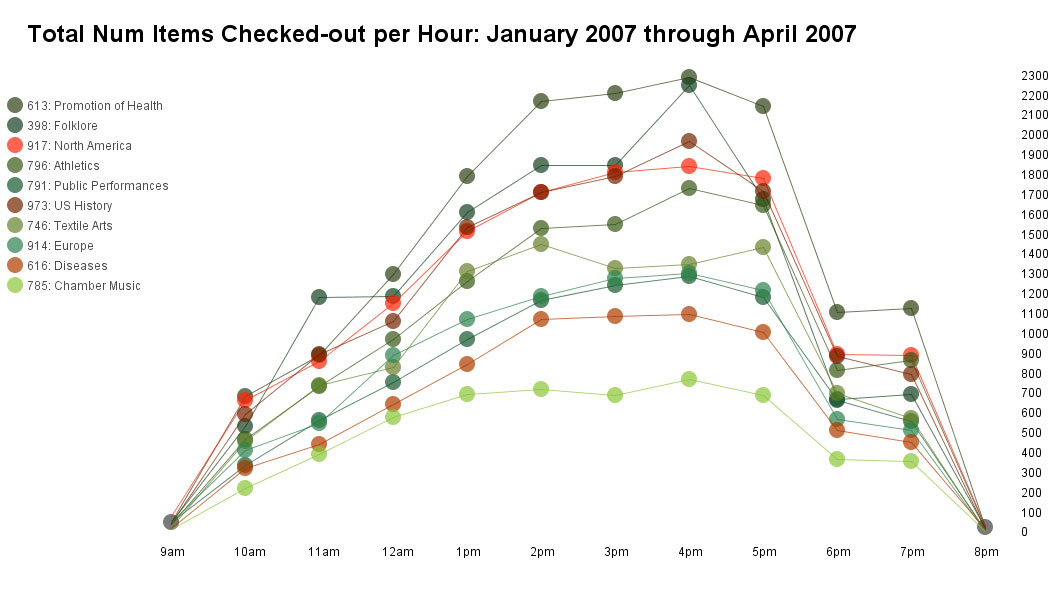
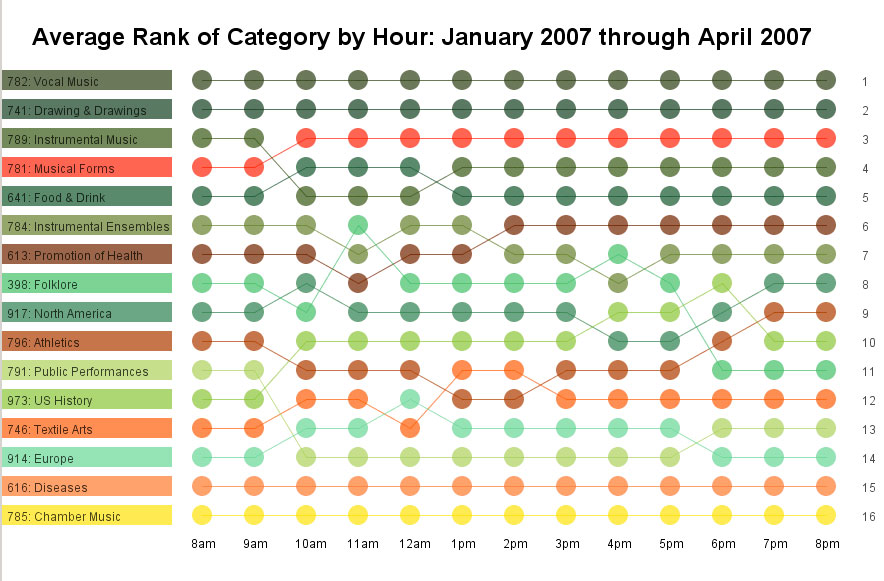
Seattle Library Data
Visualizing
Data, Ben Fry (highly recommended)
Processing | Publications
OMA/LMN
Concept Book | Prince-Ramus
| SPL
Pix
Making
Visible... | ICHIM Paper | Art
Mapping
Dewey Decimal Classification
System
Seattle Library Data | ItemTypes
| SPL Histogram
Angus Forbes Visualization | [1][2][3][4]
| code
Check-out Durations - 3D Visualizations : This project visualizes the Seattle Public Library check-in data for the month of November in 2007. It is an interactive 3D model that allows the user to navigate through the data and view it from different perspectives. | Melissa Carrasco
Analysis of SPL's check-out items in 2007 : I am analyzing the data from Seattle Public Library. Basically I am keeping track of the the total items that people checked-out over entire year of 2007 and separate these check-out items into books & media category. After I have the check-out amount for these two categories over the entire 2007 year, I create my visualization in 3D & also add some animation along with my visualization. | Yung-Ting Chuang
Music Visualizer : People listen to music and experience different feelings, comparable to those when people observe a painting. Since my emphasis at MAT is Visual and Spatial Arts, I would like to try to find a way to visualize music, as if it was a painting. | Jeungah Kim
Dewey Trends : Dewey Trends is an interactive visualization tool for examining and comparing checkout patterns of Dewey subjects. | Michael McDaniel
Panuakdet Suwannatat
- Structure: lecture/lab | 2 projects : xml
- Literature Review | Resources | research / readings
- Wattenberg [HistoryFlow][SmartMoney]
- Fry [Salary/performance]
- XML parsing | XML Basics
- Basic display of data in Processing
- Visualization Definition
- NYTimes [Iraq 2006 ] [Iraq 2008 ] [Iraq 2003-08]
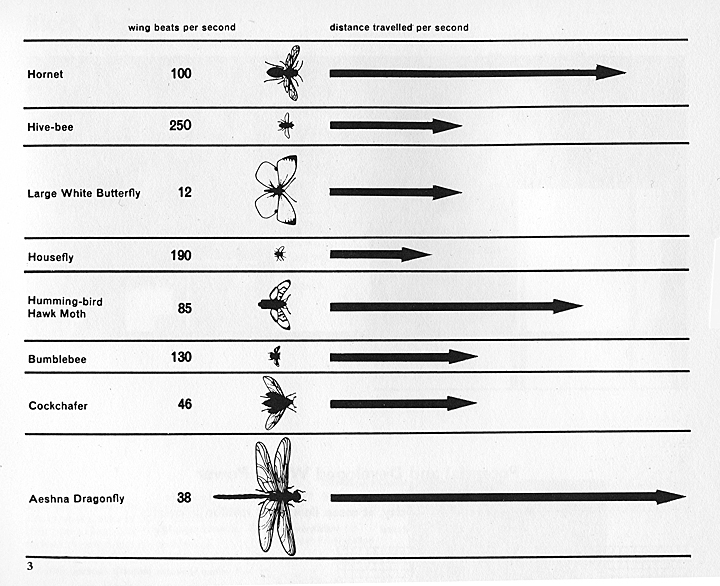
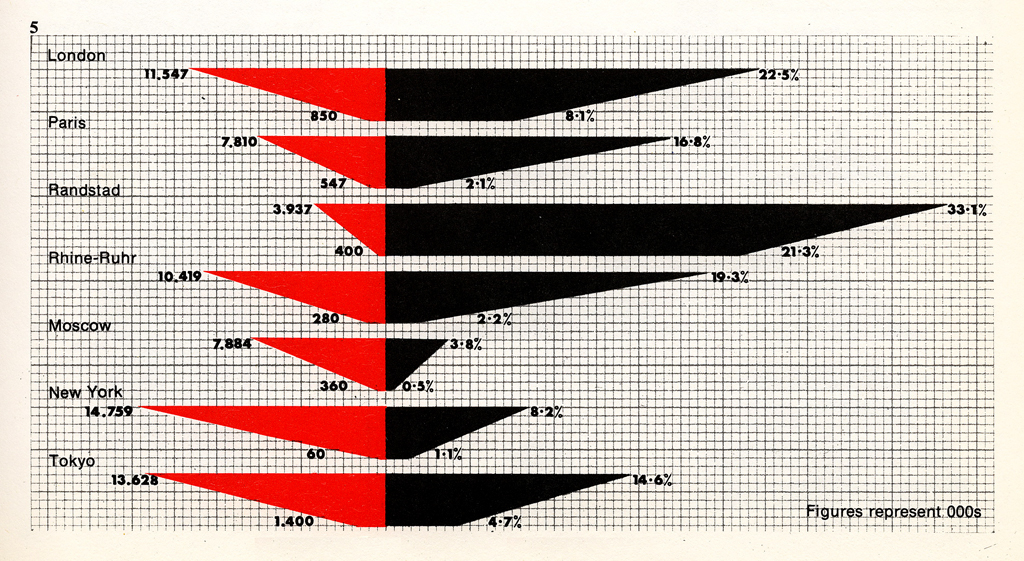
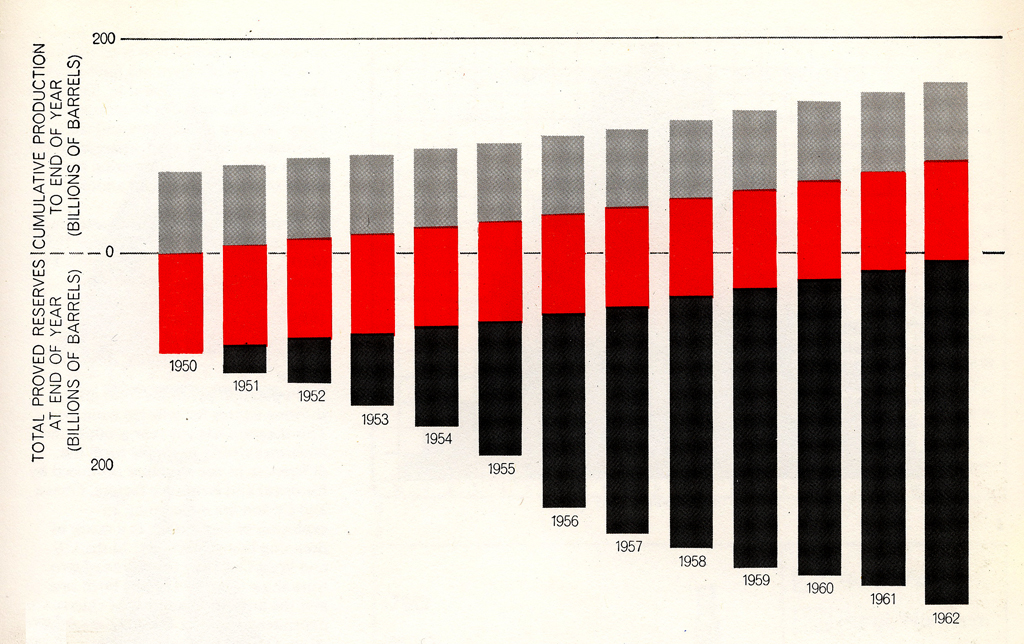
- Old Graphs [insect_flutter][2color][3DataGraph]
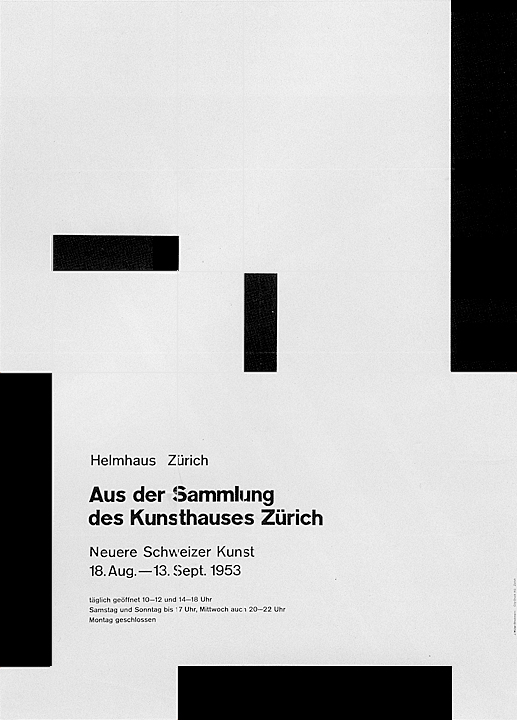
- Swiss 1953 poster [with grid]
- Scientific Visualization Studio: NASA | Wolfram's New Kind of Science
- Library Science: Information retrieval | data mapping
- Social Science/Geography: GIS | CyberSpace
- Information Aesthetics: Info Aesthetics | Visual Complexity | generatorx
Font/Typography
- Form/Architecture: | Bauhaus | Hebert/Max Bill | Giedion | Weissenhoff |
- Visual Spatial Concept Development: Warsaw Subway System | Asymptote
- Typography | Grotesk Akzidenz [ft] | Frutiger | Univers [ft] [55][57]|
- Helvetica | Futura | Tschibold |
- Metadesign | HES Geneva (serif)
- ASCII: o-o | asco-o.com | www |
- Feltron [1][2][3][4][5][6][7] | Sojamo |
- Corporate Design: Vignelli | Mau | Projekttriangle | Designers Republic
Melissa Carrasco
Yung-Ting Chuang
Jeungah Kim
Michael McDaniel
Panuakdet Suwannatat
- Sunset | CatalogTree | Textarc | IBM Many eyes
- InfoVis Indiana University
- Study of a Numerically Modelled Severe Storm, UIUC | Video
| 3D models
- Narrative in Severe Storm
- Invisible
Shape of Things Past, Art+Com
- Conceptual metaphor (Lakoff)
- The Last Clock, Ängeslevä & Ross Cooper | Tangent
- Skupin [paper] [paper]
- Angus Proj | Godwin Proj
Independent Meetings
Final Presentations
Else/Where: Mapping New
cartographies of Networks and Territories, Abrams/Hall
Information
Visualization, Robert Spence, ACM Press
Information
Visualization: Perception for Design, Colin Ware, Morgan Kaufmann
The Visual Display
of Quantitative Information, Edward Tufte
Information
Visualization, Chaomei Chen
- Participation and Literature Review 20%
The course is designed to accommodate both beginning and advanced students. All students will be expected to perform at the level of their expertise.