Cortical
Fusion

introduction
Overview
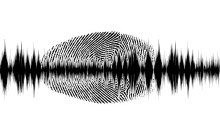
Symbol Zone
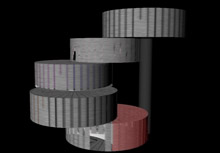
Texture Room
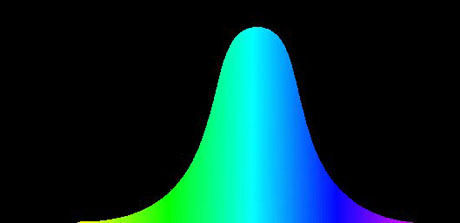
Rainbow Room
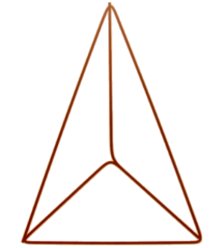
Malleable Space
Sonic Zones
Visualization Zone
Walkthrough
Visualization Zone

Data for the people
Before exiting the space, the visitor is presented with expansive visualizations of the months of collected data, tracking trends in synesthetic associations across the population. Through this, they gain an appreciation of cognitive experiences they share within the larger culture. At the same time, they see where some of their own sensory connections differ from the population at large, and may introspect on how their own personal and cultural background may have formed those individual associations.
Symbol Zone Data
The walls are filled with the the most prevalent symbolic associations tracked over months of visitor interactions. For example, words are shown with those colors most commonly associated with them. Sounds are played as the most commonly drawn shapes are morphed from one to another.
Texture Room Data
Contour maps of the Texture Zone's walls are visualized around the Visualization Zone, positioned corresponding to their locations in the Texture Zone. Textures which were touched the most are congruent with the visual or sonic stimuli that was presented at that time. The texture contours glow as the associated visuals or sounds play out around the room.
Rainbow Room Data
As a sound is played, one wall is bathed in the color most often associated by visitors with the sound. On another wall, a statistical presentation of selected colors is projected across the wall. Mathematicians may recognize this as a Gaussian distribution, while the average visitor will simply see it as a beautiful rendition of sensory associations across the population.
Malleable Space Data
On the walls are projected a 360-degree view of the malleable space at different points in time. We hear the sound or see the color that was present during the days leading up to a particular snapshot, and experience the space which visitors carved out, considering all the while how that represents an association with three-dimensional tactile sensation. This is a time-lapse experience, and every 10 seconds the image dissolves into another point in time as the imagery or sound cross-fades accordingly.
Sonic Zones Data
Finally, the Sonic Zones associations are presented. A visual will be projected as the room is washed in the sound most often associated with that visual. Every 10 seconds the sound and visual cross-fade into the next cross-population association made in the zone.
Sketches