Emotion models
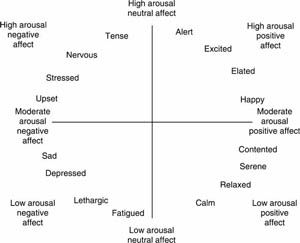
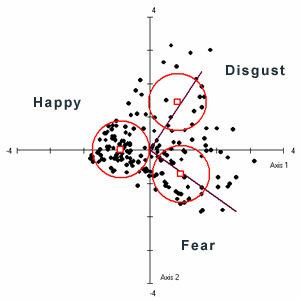
In order to analyze emotions, one should know the processes that lead to emotional activation, how to model emotions and what are the different expressions of emotions. Several differing theories regarding the relation between bodily changes, cognitive processes and emotions have been proposed, and led to various models. The most famous model is the representation of emotions in 2D valence/arousal space (Picture 1), where valence represents the way one judges a situation, from unpleasant to pleasant and arousal expresses the degree of excitement felt by people, from calm to exciting. In emotion recognition research, most commonly studied emotions are those of high arousal, both positive and negative valence: sadness, happiness and anger.
Emotion recognition methods
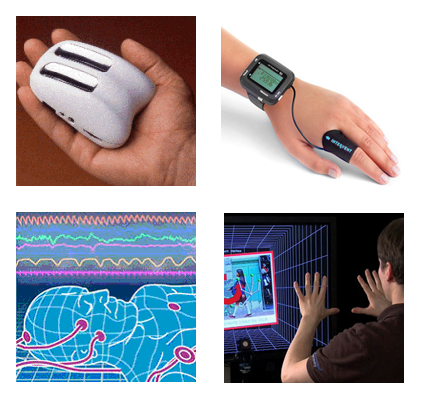
Up to date research of emotion recognition consists of analysis of voice, gestures, facial muscle movements, physiological signals originating from peripheral nervous system such as heart rate and galvanic skin resistance, to name a few. However, classification based on those signals can be problematic for several reasons:
-
They can be faked
-
They are significantly influenced by other factors whose effect is similar with an emotion-derived one. For instance, perspiration due to physical activity rather than emotions would affect a galvanic skin response (GSR)- based emotion recognition system.
-
Emotions occur without corresponding facial emotional expressions, tone changes and body movements, especially when the emotion intensity is not very high.
-
Emotion acquisition methods may not be suitable for everyday situations involving HMI. For example, a human has to look directly to the camera all the time a machine has to recognize an emotion through voice in a noisy environment.
EEG emotion recognition
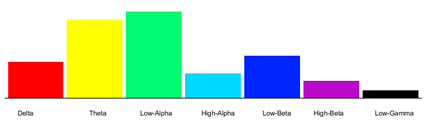
Prior to explaining second stage, it is important to know the categorization of brain waves according to their frequency:
| Type: | Frequency: | Normally occur in: |
| Delta | up to 4 Hz | deep sleep |
| Theta | 4Hz-8Hz | drowsiness, hypnosis |
| Alpha | 8Hz-12Hz | relaxed, alert state of consciousness, eyes closed |
| Betta | 12Hz-30Hz | active, busy or anxious thinking |
| Gamma | 30Hz-80Hz | higher cognitive activity, motor functions |
A system for emotion recognition has to be trained with data sets of brain wave signals matching user self-assessed emotion type. General procedure consists of three steps: (1) acquisition of signals, (2) signal processing and (3) data classification,
(1) Acquisition
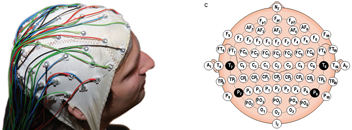
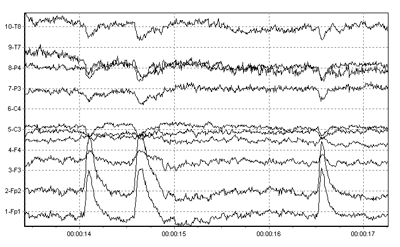
Most of the up to date research was performed using 64 channels EEG (Picture 4). Such devices are cumbersome and more research is needed towards localizing and extracting relevant signals using smaller devices. However, a promising study showed that emotion recognition based on signals acquired from four positions across the frontal lobe is possible with high accuracy.
(2) Signal processing
Electrical signals detected along the scalp by an EEG, but that originate from non-cerebral origin are called artifacts. EEG data is almost always contaminated by such artifacts. The amplitude of artifacts can be quite large relative to the size of amplitude of the cortical signals of interest. Some of the most common types of biological artifacts include:
- Eye-induced artifacts (includes eye blinks, eye movements and extra-ocular muscle activity)
- EKG (cardiac) artifacts
- EMG (muscle activation)-induced artifacts
In case of high variance signals, such as eye blinks, artifacts can be simply subtracted from the signal. In other cases, bandpass filters can be used to keep only frequencies in desired brain wave categories (e.g. 4-45Hz), or computational methods such as Independent Component Analysis (ICA) can be applied.
Undesirable noise in the signal also originates from electronic amplifier, power line interference and other external interference and is usually removed by using Average Mean Reference (AMR) method. The value of mean is calculated for each channel and is subtracted from the original raw signal value.
(3) Data classification
At this stage system undergoes training based on data sets containing both brain wave signals and its emotion type as identified by user. Ideally, trained system could recognize the same types of emotions in new recordings. Due to computational complexity, processed EEG signal data has to be reduced prior to being fed to a classifier algorithm. Some of the effective strategies for narrowing data are:
- Selecting a particular frequency band. For instance, it has been shown that satisfactory results can be achieved when working with Gamma band only.
- Using computational methods such as Common Spatial Pattern (CSP) or wavelet transform in order to provide compact representation (that shows the energy distribution of the EEG signal in time and frequency)
It is important to note that the recognition rate of emotions through EEG highly depends on data reduction method. In addition, training sets may not always be accurate, especially for lower valence or mixed emotions, due to the inability of users to accurately self-asses their emotional state.