|
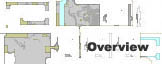
1. Movement (CL)
The purpose of the sounds mapped on to the CL data is to create
an ambiance and establish one’s
presence within a space. In order to serve the purpose and
not be overwhelming or intrude upon the sounds associated with the PSL,
only electronic hum and a few other
ambient sounds will occupy this particular databank.
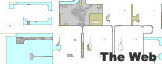
2.
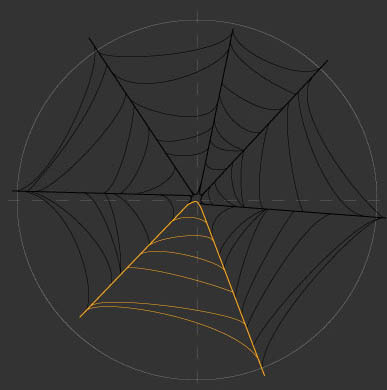
Touch (PSL)
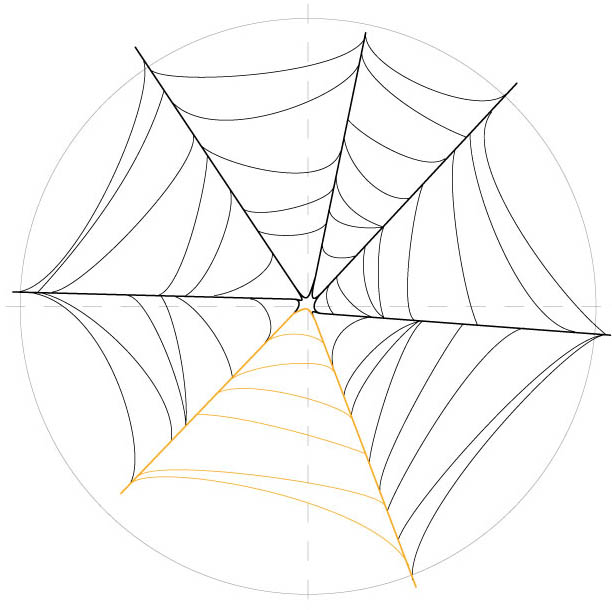
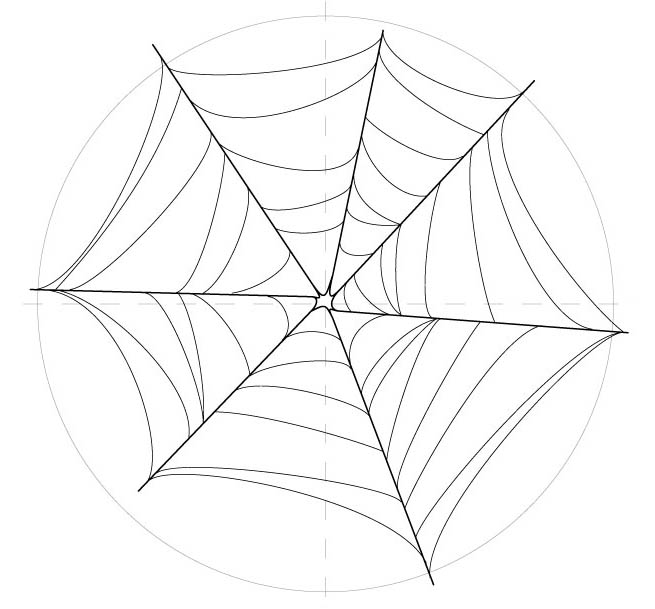
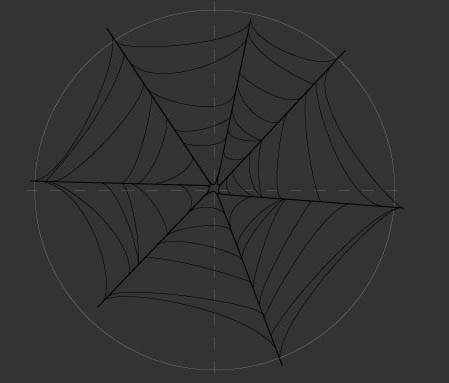
Each facet of the web corresponds
to a specific family of sound. Each
string within the facets represents
a specific process, and a different
subroutine is mapped on to every
three inches on the string. Since the Web contains piezoelectric
sensors, pressure of the touch itself plays a part in what
sound will be heard. For example, striking one’s finger against the
string on the point of A3 and thereafter gliding along string A to the
point of A7 would result in a sharp attack followed by a gradual decay
throughout. Another example would be squeezing a point on the string between
two fingers, resulting in a sharp attack that is immediately muted thereafter.
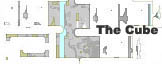
3.
Exterior motifs (a.k.a.
environmental sounds.)
The various sensors located on the roof of the cage provide description
to the current weather condition,
all of which will play a part in the behavior of the Web structure. Meaning,
if there is a strong wind due east at 30mph, the Web structure, although
physically sheltered by the Cube, will put out simulated
signals with which an accurate aural
portrayal of the wind can be generated. Similarly, based on
the amount of rain collected in the rain measuring tube, sound of raindrops
striking the Web structure can be simulated. However, having the amount
of rainfall would only allow an estimate of raindrop frequency and density,
therefore the exact location of each rain drop would have to be generated
from a pseudo-random number generator.
|
 |
 |
|
Mapping
of Location to Sound:
|
X # |
A |
B |
C |
D |
E |
F |
| 1
(3in) |
A1 |
B1 |
C1 |
D1 |
E1 |
F1 |
| 2
(6in) |
A2 |
B2 |
C2 |
D2 |
E2 |
F2 |
| 3
(9in) |
A3 |
B3 |
C3 |
D3 |
E3 |
F3 |
| 4
(12in) |
A4 |
B4 |
C4 |
D4 |
E4 |
F4 |
| 5
(15in) |
A5 |
B5 |
C5 |
D5 |
E5 |
F5 |
| 6
(18in) |
A6 |
B6 |
C6 |
D6 |
E6 |
F6 |
|
|
The table on
the left is a simplified chart for the mapping system from location to
sound. The table approximately represents the left 1 / 7 of the yellow
facet (since the size of the Cube is 25ft x 25ft, the bottom string contained
in the yellow facet is roughly 7ft long.)
The letters
A ~ F corresponds to the seven strings contained in the yellow facet;
in other words, they are different processes for the same sound source.
The numbers 1 ~ 6 corresponds to segments on each strings; in other words,
they are the subroutines. A1 ~ F6 are names for individual sounds. Before
these sounds are heard by the visitors of the Web structure, they have
to be put through audio envelopes modeled after the data of pressure.
|